Council tax Band D ranked by type of council 2026/27
The site ranks councils only against councils of the same type, and only for a year in which every council of that type has a published figure. Position 1 is the lowest published figure.
| Class | Councils | Lowest area Band D (counties: own) | Highest area Band D (counties: own) |
|---|---|---|---|
| shire districts | 164 | £2,255.21 in Basingstoke and Deane | £2,756.17 in Lewes |
| unitary authorities | 63 | £1,952.62 in Windsor and Maidenhead | £2,765.02 in Dorset |
| metropolitan districts | 36 | £2,144.84 in Dudley | £2,715.81 in Gateshead |
| London boroughs and the City of London | 33 | £1,028.21 in Wandsworth | £2,609.20 in Kingston upon Thames |
| county councils | 21 | £1,641.96 in Essex | £2,006.78 in Oxfordshire |
Source: MHCLG, Council Tax levels set by local authorities in England 2026 to 2027, Tables 9, 8a, 8b and 8c, published 25 March 2026.
Shire districts
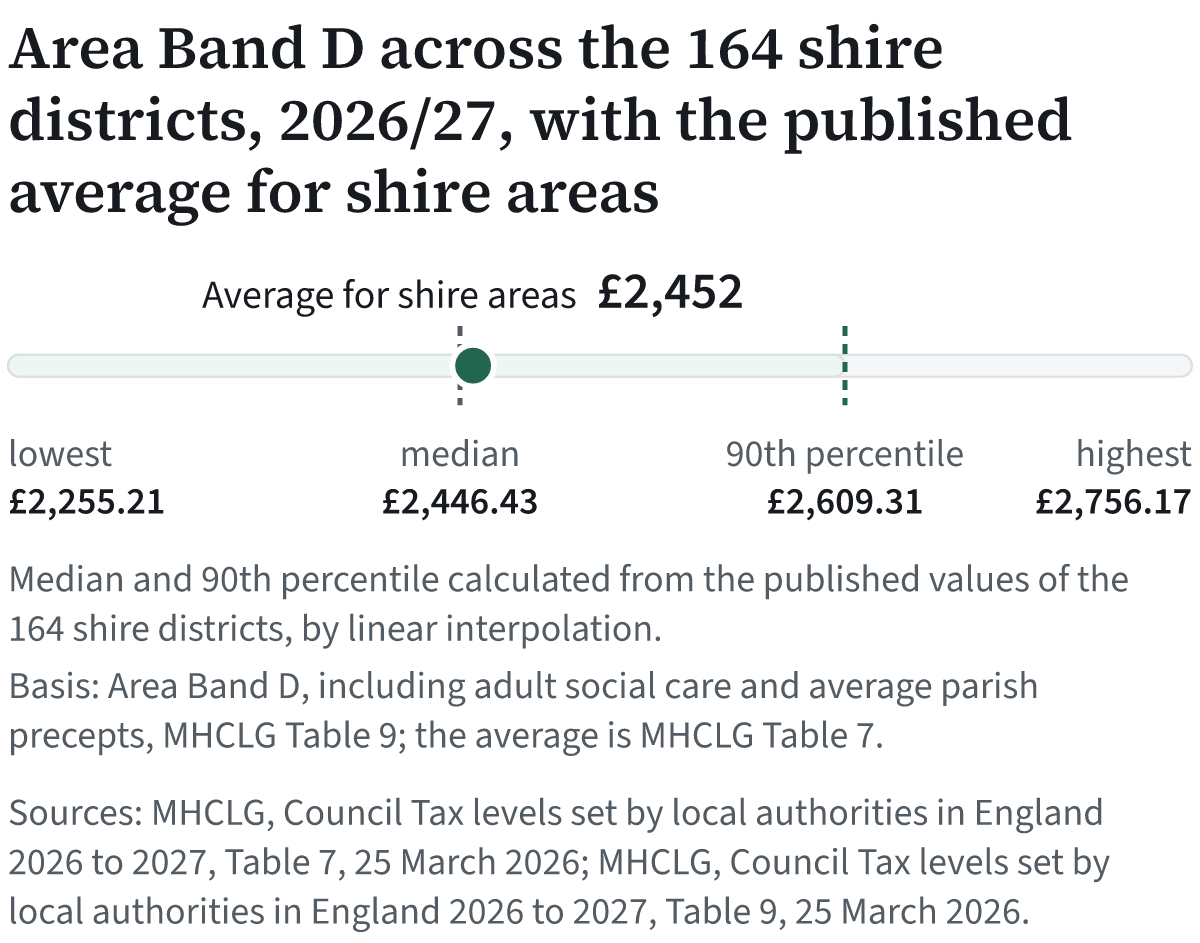
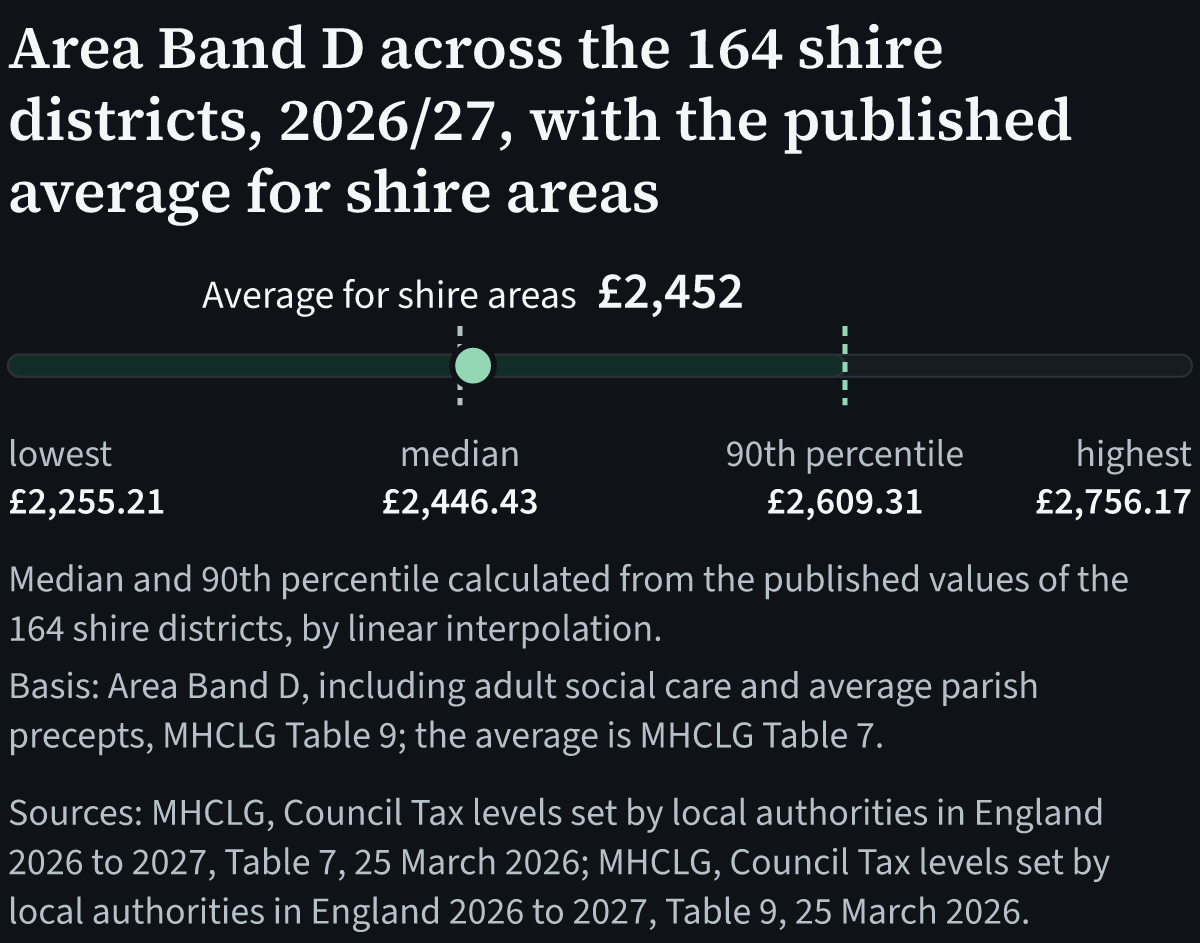
The 164 shire districts by area Band D, the whole Band D bill averaged across each council's area. The dot is the average MHCLG publishes for the type. The median, the middle council, is marked separately and is calculated from the councils' own figures.
The figures as a table
| Area Band D within shire districts, 2026/27 | How | |
|---|---|---|
| Average for shire areas | £2,452 | Published |
| Lowest of the 164 | £2,255.21 | Published |
| Median | £2,446.43 | Calculated from the 164 published values |
| 90th percentile | £2,609.31 | Calculated from the 164 published values |
| Highest of the 164 | £2,756.17 | Published |
| Median and 90th percentile calculated from the published values of the 164 shire districts, by linear interpolation. Basis: Area Band D, including adult social care and average parish precepts, MHCLG Table 9; the average is MHCLG Table 7. Sources: MHCLG, Council Tax levels set by local authorities in England 2026 to 2027, Table 7, 25 March 2026; MHCLG, Council Tax levels set by local authorities in England 2026 to 2027, Table 9, 25 March 2026. | ||
Sources: MHCLG, Council Tax levels set by local authorities in England 2026 to 2027, Table 7, 25 March 2026; MHCLG, Council Tax levels set by local authorities in England 2026 to 2027, Table 9, 25 March 2026.
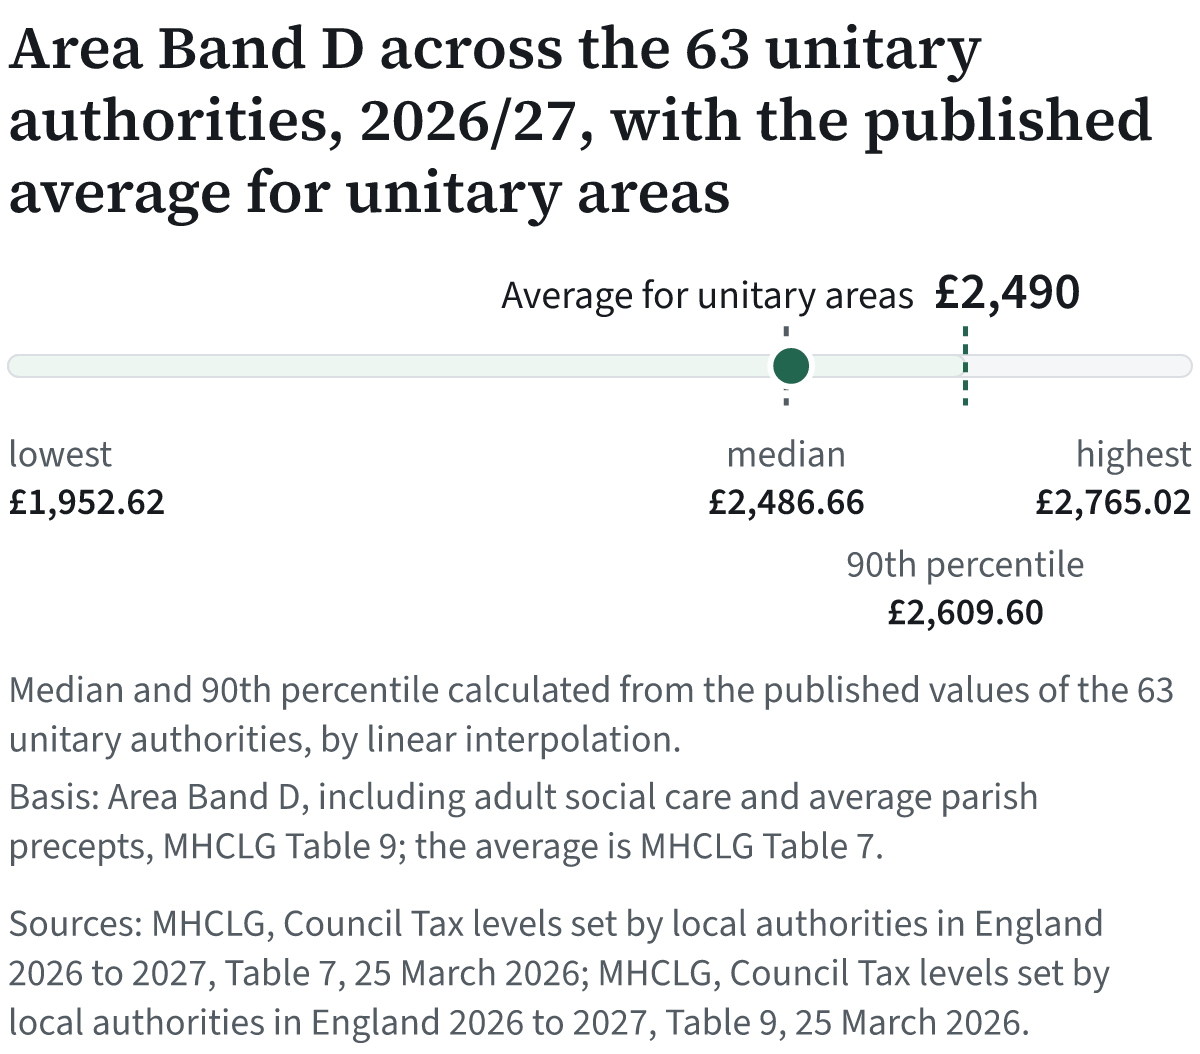
Unitary authorities
The 63 unitary authorities by area Band D, the whole Band D bill averaged across each council's area. The dot is the average MHCLG publishes for the type. The median, the middle council, is marked separately and is calculated from the councils' own figures.
The figures as a table
| Area Band D within unitary authorities, 2026/27 | How | |
|---|---|---|
| Average for unitary areas | £2,490 | Published |
| Lowest of the 63 | £1,952.62 | Published |
| Median | £2,486.66 | Calculated from the 63 published values |
| 90th percentile | £2,609.60 | Calculated from the 63 published values |
| Highest of the 63 | £2,765.02 | Published |
| Median and 90th percentile calculated from the published values of the 63 unitary authorities, by linear interpolation. Basis: Area Band D, including adult social care and average parish precepts, MHCLG Table 9; the average is MHCLG Table 7. Sources: MHCLG, Council Tax levels set by local authorities in England 2026 to 2027, Table 7, 25 March 2026; MHCLG, Council Tax levels set by local authorities in England 2026 to 2027, Table 9, 25 March 2026. | ||
Sources: MHCLG, Council Tax levels set by local authorities in England 2026 to 2027, Table 7, 25 March 2026; MHCLG, Council Tax levels set by local authorities in England 2026 to 2027, Table 9, 25 March 2026.
Metropolitan districts
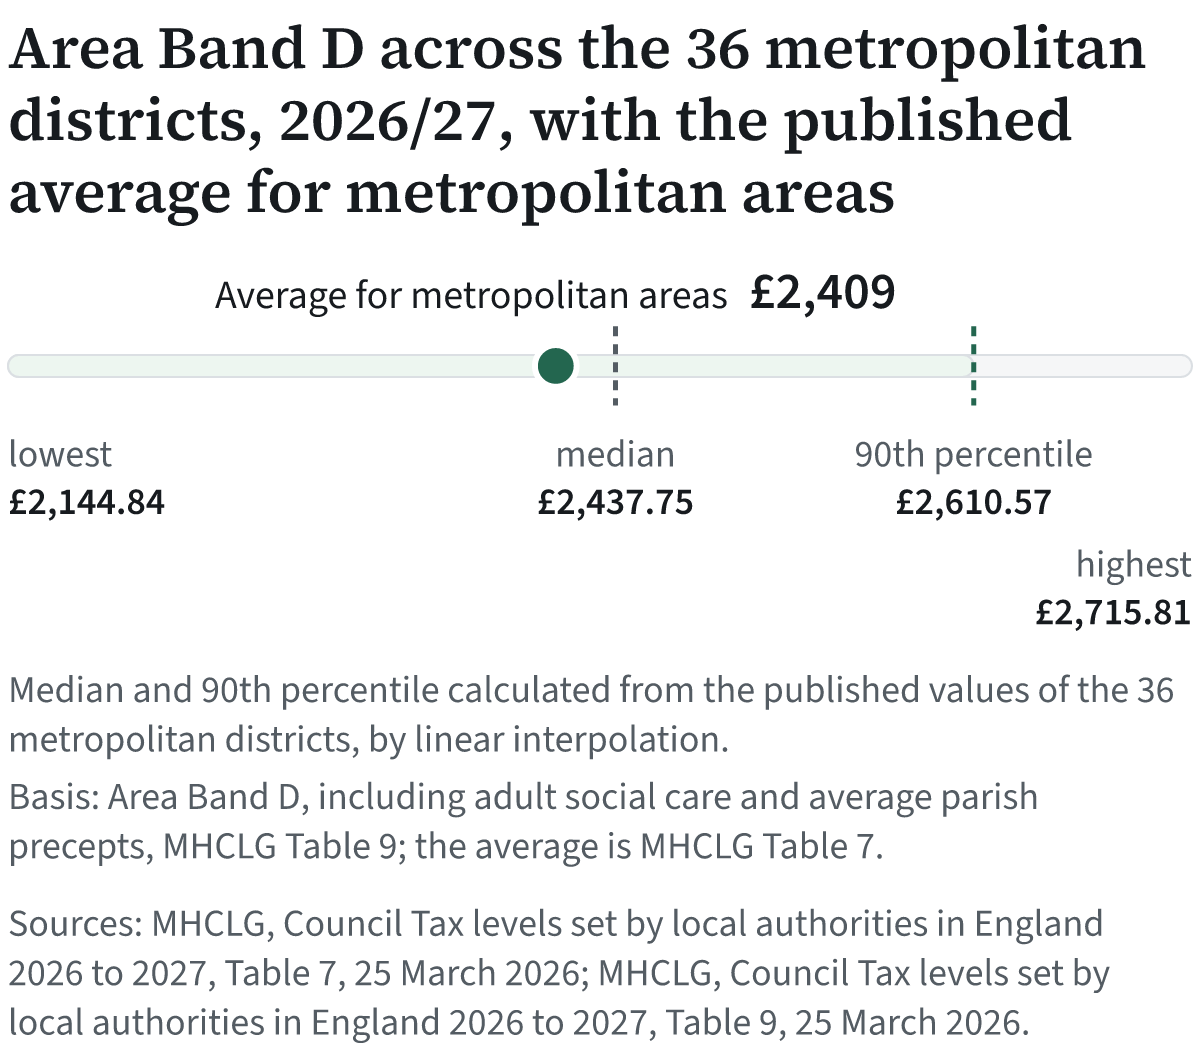
The 36 metropolitan districts by area Band D, the whole Band D bill averaged across each council's area. The dot is the average MHCLG publishes for the type. The median, the middle council, is marked separately and is calculated from the councils' own figures.
The figures as a table
| Area Band D within metropolitan districts, 2026/27 | How | |
|---|---|---|
| Average for metropolitan areas | £2,409 | Published |
| Lowest of the 36 | £2,144.84 | Published |
| Median | £2,437.75 | Calculated from the 36 published values |
| 90th percentile | £2,610.57 | Calculated from the 36 published values |
| Highest of the 36 | £2,715.81 | Published |
| Median and 90th percentile calculated from the published values of the 36 metropolitan districts, by linear interpolation. Basis: Area Band D, including adult social care and average parish precepts, MHCLG Table 9; the average is MHCLG Table 7. Sources: MHCLG, Council Tax levels set by local authorities in England 2026 to 2027, Table 7, 25 March 2026; MHCLG, Council Tax levels set by local authorities in England 2026 to 2027, Table 9, 25 March 2026. | ||
Sources: MHCLG, Council Tax levels set by local authorities in England 2026 to 2027, Table 7, 25 March 2026; MHCLG, Council Tax levels set by local authorities in England 2026 to 2027, Table 9, 25 March 2026.
London boroughs and the City of London
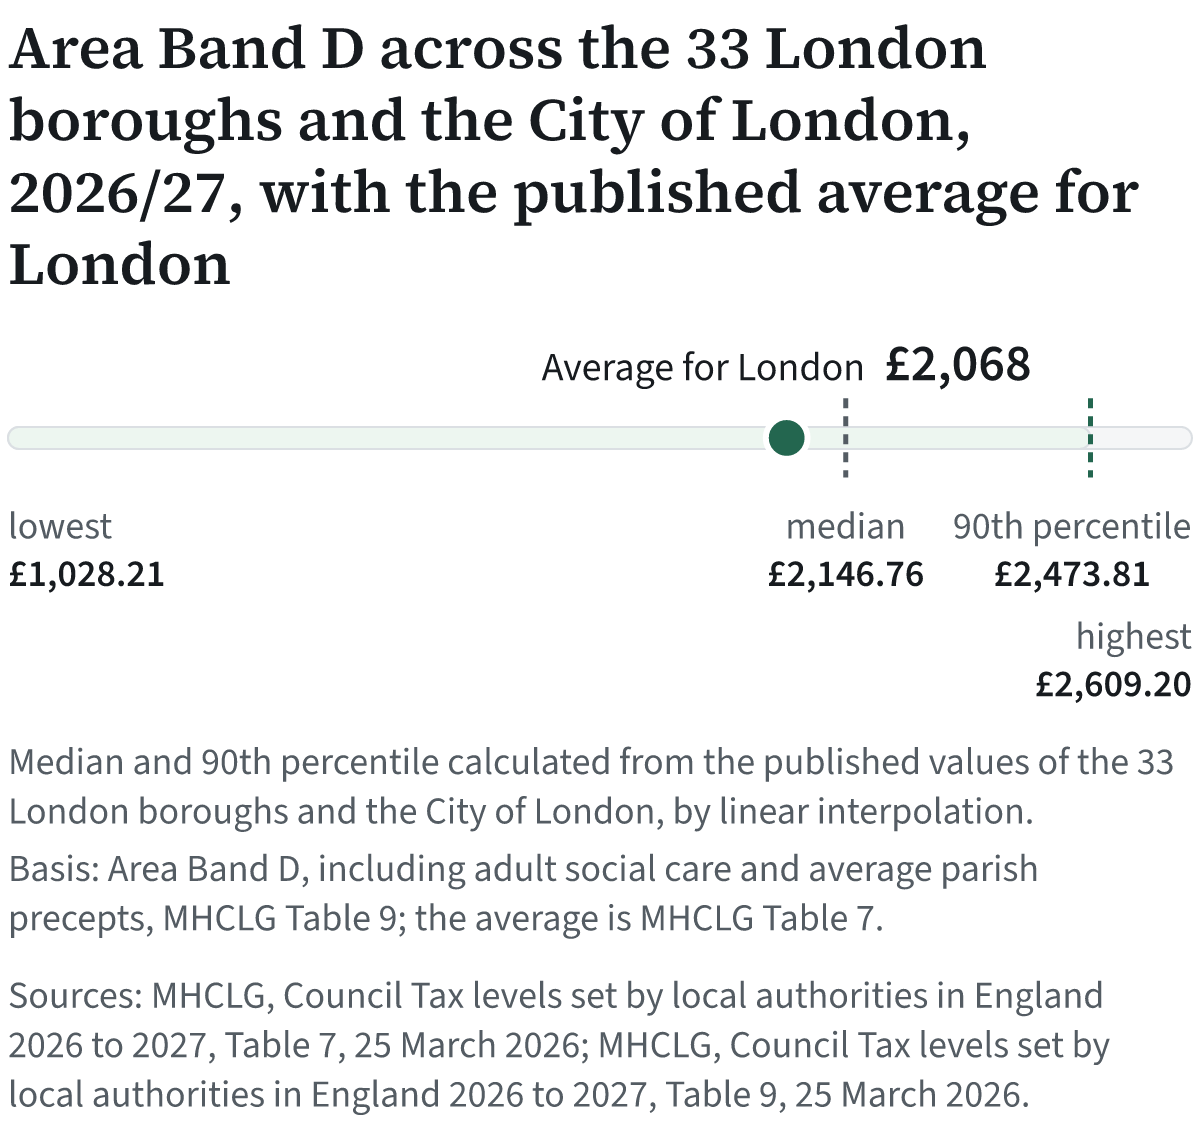
The 33 London boroughs and the City of London by area Band D, the whole Band D bill averaged across each council's area. The dot is the average MHCLG publishes for the type. The median, the middle council, is marked separately and is calculated from the councils' own figures.
The figures as a table
| Area Band D within London boroughs and the City of London, 2026/27 | How | |
|---|---|---|
| Average for London | £2,068 | Published |
| Lowest of the 33 | £1,028.21 | Published |
| Median | £2,146.76 | Calculated from the 33 published values |
| 90th percentile | £2,473.81 | Calculated from the 33 published values |
| Highest of the 33 | £2,609.20 | Published |
| Median and 90th percentile calculated from the published values of the 33 London boroughs and the City of London, by linear interpolation. Basis: Area Band D, including adult social care and average parish precepts, MHCLG Table 9; the average is MHCLG Table 7. Sources: MHCLG, Council Tax levels set by local authorities in England 2026 to 2027, Table 7, 25 March 2026; MHCLG, Council Tax levels set by local authorities in England 2026 to 2027, Table 9, 25 March 2026. | ||
Sources: MHCLG, Council Tax levels set by local authorities in England 2026 to 2027, Table 7, 25 March 2026; MHCLG, Council Tax levels set by local authorities in England 2026 to 2027, Table 9, 25 March 2026.
All 33 London boroughs and the City of London, lowest to highest
County councils
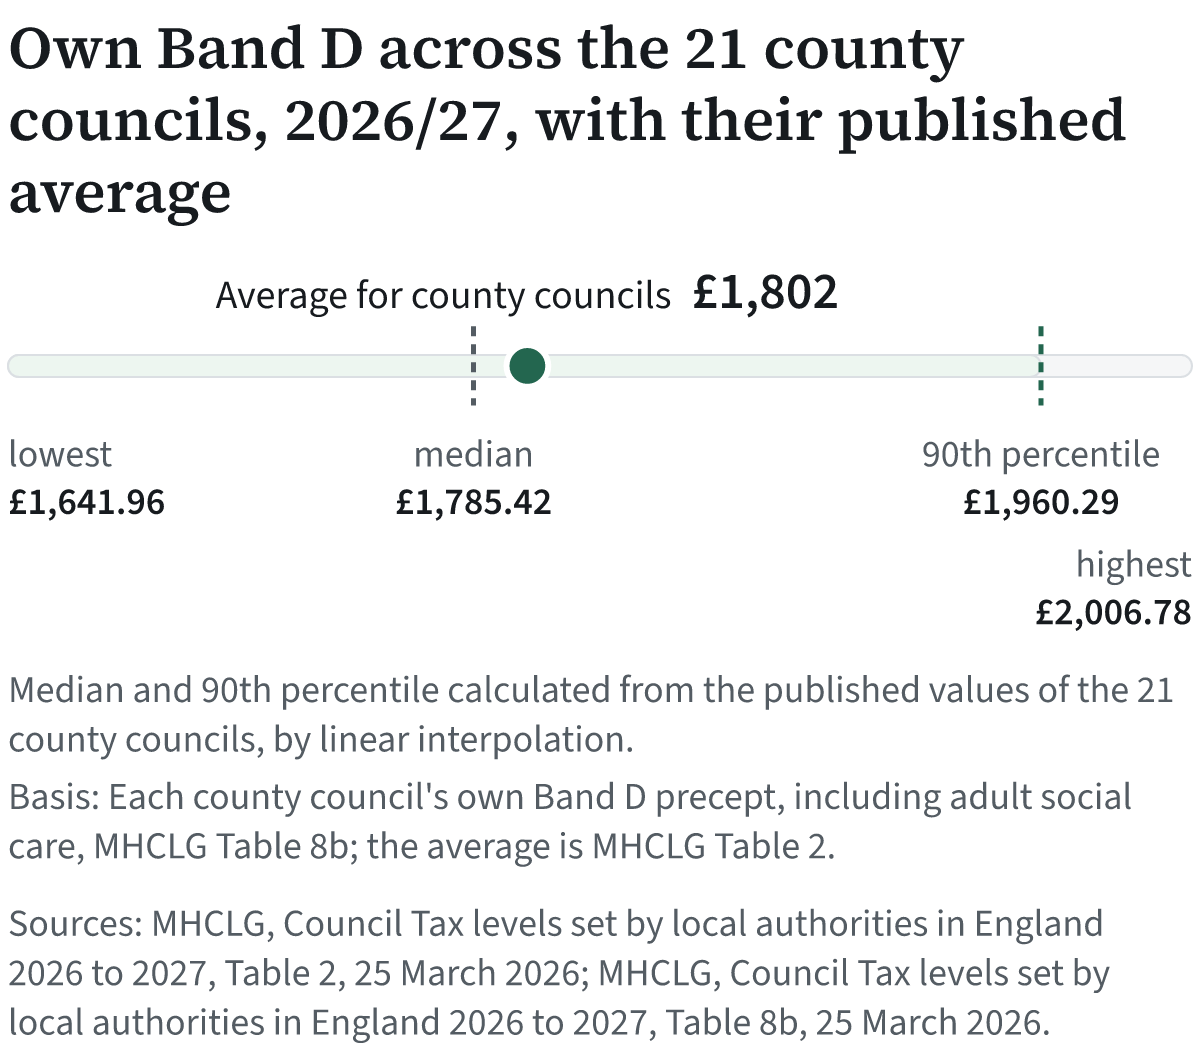
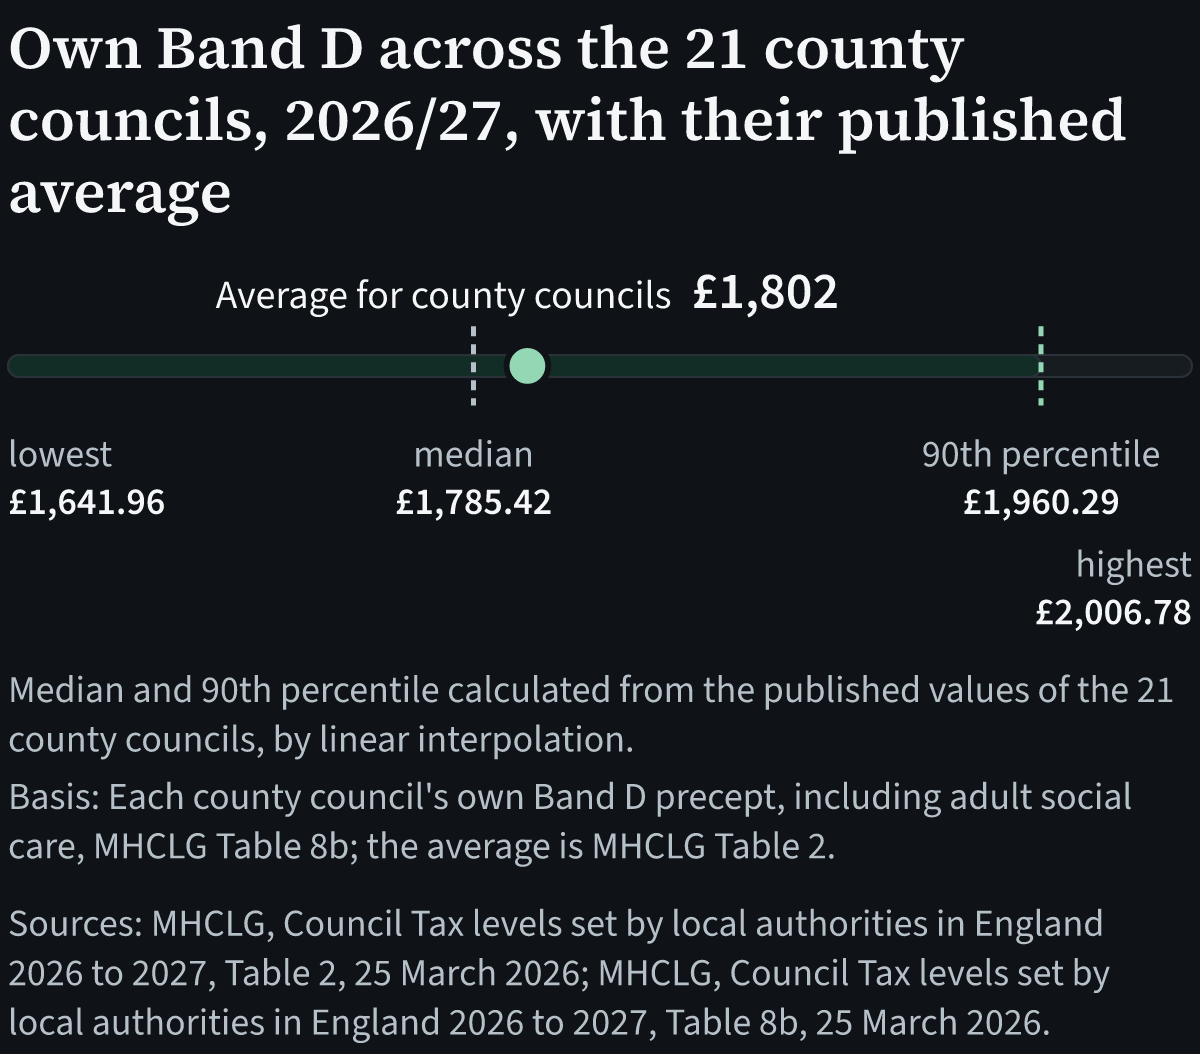
The 21 county councils by their own Band D precept, which is one part of the bill in each of their shire districts. The dot is the average MHCLG publishes for county councils.
The figures as a table
| Own Band D within county councils, 2026/27 | How | |
|---|---|---|
| Average for county councils | £1,802 | Published |
| Lowest of the 21 | £1,641.96 | Published |
| Median | £1,785.42 | Calculated from the 21 published values |
| 90th percentile | £1,960.29 | Calculated from the 21 published values |
| Highest of the 21 | £2,006.78 | Published |
| Median and 90th percentile calculated from the published values of the 21 county councils, by linear interpolation. Basis: Each county council's own Band D precept, including adult social care, MHCLG Table 8b; the average is MHCLG Table 2. Sources: MHCLG, Council Tax levels set by local authorities in England 2026 to 2027, Table 2, 25 March 2026; MHCLG, Council Tax levels set by local authorities in England 2026 to 2027, Table 8b, 25 March 2026. | ||
Sources: MHCLG, Council Tax levels set by local authorities in England 2026 to 2027, Table 2, 25 March 2026; MHCLG, Council Tax levels set by local authorities in England 2026 to 2027, Table 8b, 25 March 2026.