Follow the change
Council tax increases in England by council, 2024/25 to 2026/27
The change in your whole bill can differ from the percentage announced by one council.
How much has council tax gone up in 2026/27?
How much did council tax go up in England in 2026/27?
Source: MHCLG, Council Tax levels set by local authorities in England 2026 to 2027, Table 7, published 25 March 2026.
Includes adult social care and average parish precepts.
Council tax 2027/28: not yet set. What is known before the figures are set
Band D levels ranked within each type of council
| Class | Band D | Change on 2025/26 |
|---|---|---|
| England | £2,343 | 4.8% |
| Inner London Boroughs including City | £1,239 | 4.0% |
| Outer London Boroughs | £1,769 | 4.8% |
| London Boroughs | £1,559 | 4.5% |
| Greater London Authority | £511 | 4.1% |
| of which The Mayor's Office for Policing and Crime | £334 | 4.7% |
| of which Other Services | £176 | 3.0% |
| Combined Authorities | £89 | 3.8% |
| Metropolitan Districts | £2,020 | 4.9% |
| Metropolitan Fire and Rescue Authorities | £93 | 5.7% |
| Shire Unitary Authorities | £2,010 | 5.1% |
| Shire Counties | £1,802 | 4.6% |
| Shire Districts | £222 | 2.5% |
| Shire Fire and Rescue Authorities | £100 | 5.4% |
| Police and Crime Commissioners | £297 | 5.5% |
| Fire and Rescue Authorities | £98 | 5.5% |
Source: MHCLG, Council Tax levels set by local authorities in England 2026 to 2027, Table 2, published 25 March 2026.
Whole-area changes are calculated from published band charges, including average parish precepts. The own-share percentage is MHCLG's published change for the billing council alone. It is not the percentage change in your complete bill.
296 councils, listed alphabetically.
| Council | Earlier charge | 2026/27 | Cash change | Whole-area change | Own-share change |
|---|---|---|---|---|---|
| Adur | £2,432.50 | £2,548.28 | £115.78 | 4.76% | 2.99% |
| Amber Valley | £2,297.98 | £2,407.69 | £109.71 | 4.77% | 2.99% |
| Arun | £2,371.09 | £2,487.24 | £116.15 | 4.90% | 2.99% |
| Ashfield | £2,506.63 | £2,608.76 | £102.13 | 4.07% | 2.93% |
| Ashford | £2,311.19 | £2,410.16 | £98.97 | 4.28% | 2.99% |
| Babergh | £2,233.16 | £2,341.55 | £108.39 | 4.85% | 2.99% |
| Barking and Dagenham | £2,098.14 | £2,198.51 | £100.37 | 4.78% | 4.99% |
| Barnet | £2,035.52 | £2,132.60 | £97.08 | 4.77% | 4.98% |
| Barnsley | £2,241.35 | £2,325.96 | £84.61 | 3.77% | 3.40% |
| Basildon | £2,244.63 | £2,327.24 | £82.61 | 3.68% | 0.00% |
| Basingstoke and Deane | £2,147.87 | £2,255.21 | £107.34 | 5.00% | 3.41% |
| Bassetlaw | £2,539.53 | £2,644.95 | £105.42 | 4.15% | 2.99% |
| Bath and North East Somerset | £2,265.80 | £2,383.42 | £117.62 | 5.19% | 4.99% |
| Bedford | £2,350.94 | £2,471.74 | £120.80 | 5.14% | 4.99% |
| Bexley | £2,258.03 | £2,366.36 | £108.33 | 4.80% | 4.99% |
| Birmingham | £2,245.41 | £2,362.90 | £117.49 | 5.23% | 4.99% |
| Blaby | £2,406.77 | £2,490.22 | £83.45 | 3.47% | 2.99% |
| Blackburn with Darwen | £2,337.17 | £2,455.27 | £118.10 | 5.05% | 4.99% |
| Blackpool | £2,392.21 | £2,513.22 | £121.01 | 5.06% | 4.99% |
| Bolsover | £2,447.51 | £2,559.41 | £111.90 | 4.57% | 2.99% |
| Bolton | £2,266.53 | £2,399.74 | £133.21 | 5.88% | 4.99% |
| Boston | £2,236.62 | £2,308.73 | £72.11 | 3.22% | 2.99% |
| Bournemouth, Christchurch and Poole | £2,264.78 | £2,435.58 | £170.80 | 7.54% | 6.74% |
| Bracknell Forest | £2,155.21 | £2,264.80 | £109.59 | 5.08% | 4.99% |
| Bradford | £2,246.15 | £2,360.73 | £114.58 | 5.10% | 4.99% |
| Braintree | £2,194.67 | £2,280.34 | £85.67 | 3.90% | 0.00% |
| Breckland | £2,328.59 | £2,443.67 | £115.08 | 4.94% | 4.14% |
| Brent | £2,133.15 | £2,235.27 | £102.12 | 4.79% | 4.99% |
| Brentwood | £2,166.72 | £2,258.14 | £91.42 | 4.22% | 2.99% |
| Brighton and Hove | £2,456.78 | £2,580.54 | £123.76 | 5.04% | 4.99% |
| Bristol | £2,583.89 | £2,713.68 | £129.79 | 5.02% | 4.99% |
| Broadland | £2,327.99 | £2,437.78 | £109.79 | 4.72% | -0.31% |
| Bromley | £2,042.46 | £2,140.04 | £97.58 | 4.78% | 4.99% |
| Bromsgrove | £2,302.72 | £2,478.65 | £175.93 | 7.64% | 2.99% |
| Broxbourne | £2,198.11 | £2,306.43 | £108.32 | 4.93% | 3.06% |
| Broxtowe | £2,516.20 | £2,618.21 | £102.01 | 4.05% | 2.93% |
| Buckinghamshire | £2,401.53 | £2,526.58 | £125.05 | 5.21% | 4.99% |
| Burnley | £2,455.83 | £2,549.42 | £93.59 | 3.81% | 1.99% |
| Bury | £2,414.58 | £2,555.15 | £140.57 | 5.82% | 4.99% |
| Calderdale | £2,302.33 | £2,420.15 | £117.82 | 5.12% | 4.99% |
| Cambridge | £2,355.41 | £2,467.02 | £111.61 | 4.74% | 2.99% |
| Camden | £2,106.69 | £2,207.55 | £100.86 | 4.79% | 4.99% |
| Cannock Chase | £2,282.30 | £2,375.83 | £93.53 | 4.10% | 2.99% |
| Canterbury | £2,321.73 | £2,419.33 | £97.60 | 4.20% | 2.99% |
| Castle Point | £2,227.21 | £2,318.63 | £91.42 | 4.10% | 2.98% |
| Central Bedfordshire | £2,394.14 | £2,516.16 | £122.02 | 5.10% | 4.99% |
| Charnwood | £2,327.50 | £2,405.64 | £78.14 | 3.36% | 2.31% |
| Chelmsford | £2,206.97 | £2,300.18 | £93.21 | 4.22% | 2.97% |
| Cheltenham | £2,258.28 | £2,369.52 | £111.24 | 4.93% | 2.99% |
| Cherwell | £2,463.87 | £2,582.96 | £119.09 | 4.83% | 3.15% |
| Cheshire East | £2,332.61 | £2,454.87 | £122.26 | 5.24% | 4.99% |
| Cheshire West and Chester | £2,392.03 | £2,517.33 | £125.30 | 5.24% | 4.99% |
| Chesterfield | £2,233.12 | £2,339.49 | £106.37 | 4.76% | 2.99% |
| Chichester | £2,346.40 | £2,469.68 | £123.28 | 5.25% | 2.99% |
| Chorley | £2,342.85 | £2,430.23 | £87.38 | 3.73% | 0.00% |
| City of London | £1,274.07 | £1,329.56 | £55.49 | 4.36% | 4.99% |
| Colchester | £2,192.08 | £2,282.85 | £90.77 | 4.14% | 2.99% |
| Cornwall | £2,459.92 | £2,590.93 | £131.01 | 5.33% | 4.99% |
| Cotswold | £2,276.70 | £2,391.65 | £114.95 | 5.05% | 3.15% |
| Coventry | £2,413.68 | £2,516.72 | £103.04 | 4.27% | 3.95% |
| Crawley | £2,306.49 | £2,418.46 | £111.97 | 4.85% | 2.99% |
| Croydon | £2,480.48 | £2,599.91 | £119.43 | 4.81% | 4.99% |
| Cumberland | £2,393.90 | £2,511.32 | £117.42 | 4.90% | 4.99% |
| Dacorum | £2,294.23 | £2,408.51 | £114.28 | 4.98% | 2.99% |
| Darlington | £2,371.60 | £2,493.83 | £122.23 | 5.15% | 4.99% |
| Dartford | £2,280.55 | £2,375.15 | £94.60 | 4.15% | 0.00% |
| Derby | £2,195.75 | £2,306.00 | £110.25 | 5.02% | 4.99% |
| Derbyshire Dales | £2,332.42 | £2,444.70 | £112.28 | 4.81% | 2.99% |
| Doncaster | £2,110.50 | £2,167.75 | £57.25 | 2.71% | 2.00% |
| Dorset | £2,630.30 | £2,765.02 | £134.72 | 5.12% | 4.99% |
| Dover | £2,364.45 | £2,461.74 | £97.29 | 4.11% | 2.98% |
| Dudley | £2,038.57 | £2,144.84 | £106.27 | 5.21% | 4.99% |
| Durham | £2,551.17 | £2,622.15 | £70.98 | 2.78% | 1.99% |
| Ealing | £2,041.02 | £2,138.53 | £97.51 | 4.78% | 4.99% |
| East Cambridgeshire | £2,374.13 | £2,485.18 | £111.05 | 4.68% | 0.00% |
| East Devon | £2,461.40 | £2,595.46 | £134.06 | 5.45% | 2.99% |
| East Hampshire | £2,231.64 | £2,343.92 | £112.28 | 5.03% | 3.29% |
| East Hertfordshire | £2,339.63 | £2,454.78 | £115.15 | 4.92% | 2.98% |
| East Lindsey | £2,201.57 | £2,275.88 | £74.31 | 3.38% | 2.99% |
| East Riding of Yorkshire | £2,343.55 | £2,466.08 | £122.53 | 5.23% | 4.99% |
| East Staffordshire | £2,257.48 | £2,351.34 | £93.86 | 4.16% | 2.81% |
| East Suffolk | £2,222.36 | £2,334.80 | £112.44 | 5.06% | 2.95% |
| Eastbourne | £2,532.49 | £2,654.28 | £121.79 | 4.81% | 2.99% |
| Eastleigh | £2,227.68 | £2,342.21 | £114.53 | 5.14% | -8.39% |
| Elmbridge | £2,442.92 | £2,557.75 | £114.83 | 4.70% | 3.00% |
| Enfield | £2,164.02 | £2,267.67 | £103.65 | 4.79% | 4.99% |
| Epping Forest | £2,186.69 | £2,277.21 | £90.52 | 4.14% | 2.98% |
| Epsom and Ewell | £2,416.84 | £2,530.84 | £114.00 | 4.72% | 2.98% |
| Erewash | £2,260.06 | £2,360.64 | £100.58 | 4.45% | 0.00% |
| Exeter | £2,379.90 | £2,495.36 | £115.46 | 4.85% | 2.99% |
| Fareham | £2,164.55 | £2,270.55 | £106.00 | 4.90% | 2.99% |
| Fenland | £2,432.81 | £2,537.74 | £104.93 | 4.31% | -0.57% |
| Folkestone and Hythe | £2,437.35 | £2,538.75 | £101.40 | 4.16% | 2.99% |
| Forest of Dean | £2,326.88 | £2,443.42 | £116.54 | 5.01% | 2.99% |
| Fylde | £2,387.78 | £2,483.94 | £96.16 | 4.03% | 2.99% |
| Gateshead | £2,578.46 | £2,715.81 | £137.35 | 5.33% | 4.99% |
| Gedling | £2,507.09 | £2,609.55 | £102.46 | 4.09% | 2.99% |
| Gloucester | £2,246.16 | £2,355.84 | £109.68 | 4.88% | 2.99% |
| Gosport | £2,236.14 | £2,344.29 | £108.15 | 4.84% | 2.99% |
| Gravesham | £2,313.06 | £2,408.24 | £95.18 | 4.11% | 2.99% |
| Great Yarmouth | £2,305.13 | £2,414.41 | £109.28 | 4.74% | 2.99% |
| Greenwich | £2,011.81 | £2,107.86 | £96.05 | 4.77% | 4.99% |
| Guildford | £2,428.89 | £2,547.30 | £118.41 | 4.88% | 2.99% |
| Hackney | £1,966.51 | £2,060.30 | £93.79 | 4.77% | 4.99% |
| Halton | £2,249.34 | £2,366.61 | £117.27 | 5.21% | 4.99% |
| Hammersmith and Fulham | £1,451.42 | £1,519.51 | £68.09 | 4.69% | 4.99% |
| Harborough | £2,324.96 | £2,389.87 | £64.91 | 2.79% | -5.00% |
| Haringey | £2,207.94 | £2,313.78 | £105.84 | 4.79% | 4.99% |
| Harlow | £2,216.43 | £2,298.69 | £82.26 | 3.71% | 0.00% |
| Harrow | £2,395.86 | £2,511.07 | £115.21 | 4.81% | 4.99% |
| Hart | £2,285.15 | £2,400.02 | £114.87 | 5.03% | 2.99% |
| Hartlepool | £2,498.53 | £2,560.20 | £61.67 | 2.47% | 1.98% |
| Hastings | £2,554.14 | £2,676.58 | £122.44 | 4.79% | 2.99% |
| Havant | £2,212.89 | £2,320.28 | £107.39 | 4.85% | 2.97% |
| Havering | £2,313.55 | £2,424.66 | £111.11 | 4.80% | 4.99% |
| Herefordshire | £2,449.17 | £2,574.37 | £125.20 | 5.11% | 4.99% |
| Hertsmere | £2,289.22 | £2,405.83 | £116.61 | 5.09% | 2.99% |
| High Peak | £2,275.52 | £2,384.66 | £109.14 | 4.80% | 2.99% |
| Hillingdon | £1,952.38 | £2,045.46 | £93.08 | 4.77% | 4.99% |
| Hinckley and Bosworth | £2,304.14 | £2,382.62 | £78.48 | 3.41% | 2.60% |
| Horsham | £2,321.54 | £2,441.01 | £119.47 | 5.15% | 2.80% |
| Hounslow | £2,085.82 | £2,185.56 | £99.74 | 4.78% | 4.99% |
| Huntingdonshire | £2,439.67 | £2,556.40 | £116.73 | 4.78% | 3.01% |
| Hyndburn | £2,380.02 | £2,465.98 | £85.96 | 3.61% | 0.00% |
| Ipswich | £2,358.54 | £2,468.25 | £109.71 | 4.65% | 2.98% |
| Isle of Wight | £2,493.36 | £2,625.79 | £132.43 | 5.31% | 4.99% |
| Isles of Scilly | £1,950.03 | £2,047.96 | £97.93 | 5.02% | 4.99% |
| Islington | £2,012.10 | £2,108.15 | £96.05 | 4.77% | 4.99% |
| Kensington and Chelsea | £1,591.59 | £1,666.65 | £75.06 | 4.72% | 4.99% |
| Kings Lynn and West Norfolk | £2,318.63 | £2,430.13 | £111.50 | 4.81% | 2.99% |
| Kingston upon Hull | £2,182.52 | £2,295.04 | £112.52 | 5.16% | 4.99% |
| Kingston upon Thames | £2,489.34 | £2,609.20 | £119.86 | 4.81% | 4.99% |
| Kirklees | £2,321.76 | £2,441.07 | £119.31 | 5.14% | 4.99% |
| Knowsley | £2,371.28 | £2,488.25 | £116.97 | 4.93% | 4.99% |
| Lambeth | £1,953.95 | £2,047.11 | £93.16 | 4.77% | 4.99% |
| Lancaster | £2,407.50 | £2,503.19 | £95.69 | 3.97% | 2.99% |
| Leeds | £2,172.39 | £2,283.73 | £111.34 | 5.13% | 5.00% |
| Leicester | £2,407.72 | £2,528.75 | £121.03 | 5.03% | 5.00% |
| Lewes | £2,627.39 | £2,756.17 | £128.78 | 4.90% | 2.99% |
| Lewisham | £2,135.13 | £2,237.33 | £102.20 | 4.79% | 4.99% |
| Lichfield | £2,259.21 | £2,351.90 | £92.69 | 4.10% | 1.99% |
| Lincoln | £2,260.98 | £2,323.08 | £62.10 | 2.75% | 0.00% |
| Liverpool | £2,546.45 | £2,673.59 | £127.14 | 4.99% | 4.99% |
| Luton | £2,320.43 | £2,439.93 | £119.50 | 5.15% | 4.99% |
| Maidstone | £2,403.78 | £2,502.59 | £98.81 | 4.11% | 2.98% |
| Maldon | £2,232.83 | £2,328.37 | £95.54 | 4.28% | 2.99% |
| Malvern Hills | £2,280.82 | £2,450.92 | £170.10 | 7.46% | 0.00% |
| Manchester | £2,183.03 | £2,312.04 | £129.01 | 5.91% | 4.99% |
| Mansfield | £2,498.40 | £2,600.38 | £101.98 | 4.08% | 2.99% |
| Medway | £2,215.38 | £2,328.55 | £113.17 | 5.11% | 4.99% |
| Melton | £2,350.68 | £2,429.67 | £78.99 | 3.36% | 2.99% |
| Merton | £2,094.43 | £2,146.76 | £52.33 | 2.50% | 2.01% |
| Mid Devon | £2,521.17 | £2,656.41 | £135.24 | 5.36% | 3.00% |
| Mid Suffolk | £2,208.43 | £2,316.88 | £108.45 | 4.91% | 2.99% |
| Mid Sussex | £2,356.49 | £2,474.26 | £117.77 | 5.00% | 2.95% |
| Middlesbrough | £2,487.65 | £2,549.16 | £61.51 | 2.47% | 2.00% |
| Milton Keynes | £2,257.98 | £2,372.21 | £114.23 | 5.06% | 4.99% |
| Mole Valley | £2,405.75 | £2,519.86 | £114.11 | 4.74% | 2.99% |
| New Forest | £2,303.37 | £2,419.76 | £116.39 | 5.05% | 2.99% |
| Newark and Sherwood | £2,582.22 | £2,682.10 | £99.88 | 3.87% | 0.00% |
| Newcastle upon Tyne | £2,413.15 | £2,542.19 | £129.04 | 5.35% | 4.99% |
| Newcastle-under-Lyme | £2,244.85 | £2,334.25 | £89.40 | 3.98% | 1.99% |
| Newham | £1,855.96 | £1,944.23 | £88.27 | 4.76% | 4.99% |
| North Devon | £2,514.66 | £2,642.21 | £127.55 | 5.07% | 2.99% |
| North East Derbyshire | £2,354.93 | £2,466.57 | £111.64 | 4.74% | 2.99% |
| North East Lincolnshire | £2,371.01 | £2,483.85 | £112.84 | 4.76% | 4.50% |
| North Hertfordshire | £2,332.61 | £2,448.52 | £115.91 | 4.97% | 2.99% |
| North Kesteven | £2,261.06 | £2,337.81 | £76.75 | 3.39% | 2.81% |
| North Lincolnshire | £2,238.09 | £2,348.46 | £110.37 | 4.93% | 4.68% |
| North Norfolk | £2,341.13 | £2,459.93 | £118.80 | 5.07% | 2.96% |
| North Northamptonshire | £2,301.93 | £2,423.96 | £122.03 | 5.30% | 4.99% |
| North Somerset | £2,294.94 | £2,491.22 | £196.28 | 8.55% | 8.99% |
| North Tyneside | £2,336.45 | £2,461.77 | £125.32 | 5.36% | 4.99% |
| North Warwickshire | £2,431.78 | £2,532.10 | £100.32 | 4.13% | 0.00% |
| North West Leicestershire | £2,338.10 | £2,418.20 | £80.10 | 3.43% | 2.71% |
| North Yorkshire | £2,418.26 | £2,544.34 | £126.08 | 5.21% | 4.99% |
| Northumberland | £2,464.63 | £2,596.94 | £132.31 | 5.37% | 4.99% |
| Norwich | £2,391.59 | £2,503.44 | £111.85 | 4.68% | 2.99% |
| Nottingham | £2,656.19 | £2,755.39 | £99.20 | 3.73% | 3.50% |
| Nuneaton and Bedworth | £2,398.13 | £2,502.16 | £104.03 | 4.34% | 2.99% |
| Oadby and Wigston | £2,330.02 | £2,406.85 | £76.83 | 3.30% | 2.50% |
| Oldham | £2,459.40 | £2,602.23 | £142.83 | 5.81% | 4.99% |
| Oxford | £2,557.13 | £2,678.40 | £121.27 | 4.74% | 2.99% |
| Pendle | £2,535.19 | £2,640.18 | £104.99 | 4.14% | 2.99% |
| Peterborough | £2,185.72 | £2,293.47 | £107.75 | 4.93% | 4.99% |
| Plymouth | £2,325.42 | £2,441.85 | £116.43 | 5.01% | 4.99% |
| Portsmouth | £2,180.92 | £2,291.71 | £110.79 | 5.08% | 4.99% |
| Preston | £2,477.85 | £2,575.74 | £97.89 | 3.95% | 2.99% |
| Reading | £2,487.11 | £2,612.77 | £125.66 | 5.05% | 4.99% |
| Redbridge | £2,189.67 | £2,294.58 | £104.91 | 4.79% | 4.99% |
| Redcar and Cleveland | £2,424.47 | £2,544.48 | £120.01 | 4.95% | 4.99% |
| Redditch | £2,289.33 | £2,462.95 | £173.62 | 7.58% | 2.99% |
| Reigate and Banstead | £2,459.20 | £2,566.61 | £107.41 | 4.37% | 0.00% |
| Ribble Valley | £2,299.58 | £2,386.50 | £86.92 | 3.78% | 0.00% |
| Richmond upon Thames | £2,372.07 | £2,486.10 | £114.03 | 4.81% | 4.99% |
| Rochdale | £2,458.09 | £2,600.83 | £142.74 | 5.81% | 4.99% |
| Rochford | £2,268.00 | £2,363.48 | £95.48 | 4.21% | 1.95% |
| Rossendale | £2,424.37 | £2,519.97 | £95.60 | 3.94% | 2.99% |
| Rother | £2,561.29 | £2,700.95 | £139.66 | 5.45% | 1.31% |
| Rotherham | £2,283.26 | £2,381.53 | £98.27 | 4.30% | 3.95% |
| Rugby | £2,378.04 | £2,483.05 | £105.01 | 4.42% | 2.99% |
| Runnymede | £2,380.06 | £2,492.99 | £112.93 | 4.74% | 2.99% |
| Rushcliffe | £2,531.50 | £2,643.27 | £111.77 | 4.42% | 0.48% |
| Rushmoor | £2,212.82 | £2,320.28 | £107.46 | 4.86% | 3.00% |
| Rutland | £2,671.01 | £2,737.58 | £66.57 | 2.49% | 2.00% |
| Salford | £2,452.02 | £2,594.45 | £142.43 | 5.81% | 4.99% |
| Sandwell | £2,133.45 | £2,244.46 | £111.01 | 5.20% | 4.99% |
| Sefton | £2,460.92 | £2,583.22 | £122.30 | 4.97% | 4.99% |
| Sevenoaks | £2,419.44 | £2,522.36 | £102.92 | 4.25% | 2.98% |
| Sheffield | £2,388.76 | £2,510.16 | £121.40 | 5.08% | 4.99% |
| Shropshire | £2,318.80 | £2,528.18 | £209.38 | 9.03% | 8.99% |
| Slough | £2,298.55 | £2,414.44 | £115.89 | 5.04% | 4.99% |
| Solihull | £2,087.81 | £2,197.26 | £109.45 | 5.24% | 4.99% |
| Somerset | £2,438.62 | £2,560.59 | £121.97 | 5.00% | 4.98% |
| South Cambridgeshire | £2,414.52 | £2,536.25 | £121.73 | 5.04% | 2.99% |
| South Derbyshire | £2,231.86 | £2,339.61 | £107.75 | 4.83% | 2.99% |
| South Gloucestershire | £2,427.90 | £2,550.59 | £122.69 | 5.05% | 4.99% |
| South Hams | £2,491.75 | £2,615.22 | £123.47 | 4.96% | 2.99% |
| South Holland | £2,205.31 | £2,278.20 | £72.89 | 3.31% | 2.96% |
| South Kesteven | £2,186.95 | £2,260.00 | £73.05 | 3.34% | 2.99% |
| South Norfolk | £2,367.89 | £2,482.87 | £114.98 | 4.86% | 2.85% |
| South Oxfordshire | £2,474.44 | £2,597.57 | £123.13 | 4.98% | 3.31% |
| South Ribble | £2,352.12 | £2,442.66 | £90.54 | 3.85% | 1.90% |
| South Staffordshire | £2,219.66 | £2,313.67 | £94.01 | 4.24% | 3.44% |
| South Tyneside | £2,311.18 | £2,434.43 | £123.25 | 5.33% | 4.95% |
| Southampton | £2,266.44 | £2,381.48 | £115.04 | 5.08% | 4.99% |
| Southend-on-Sea | £2,154.65 | £2,265.17 | £110.52 | 5.13% | 4.99% |
| Southwark | £1,877.90 | £1,967.26 | £89.36 | 4.76% | 4.99% |
| Spelthorne | £2,412.78 | £2,526.44 | £113.66 | 4.71% | 2.90% |
| St Albans | £2,305.95 | £2,419.22 | £113.27 | 4.91% | 2.99% |
| St Helens | £2,288.53 | £2,403.38 | £114.85 | 5.02% | 4.99% |
| Stafford | £2,210.78 | £2,302.68 | £91.90 | 4.16% | 2.99% |
| Staffordshire Moorlands | £2,240.43 | £2,338.21 | £97.78 | 4.36% | 2.98% |
| Stevenage | £2,281.28 | £2,391.97 | £110.69 | 4.85% | 2.99% |
| Stockport | £2,475.31 | £2,618.90 | £143.59 | 5.80% | 4.99% |
| Stockton-on-Tees | £2,468.74 | £2,589.83 | £121.09 | 4.90% | 4.95% |
| Stoke-on-Trent | £2,078.34 | £2,183.12 | £104.78 | 5.04% | 4.99% |
| Stratford-on-Avon | £2,379.91 | £2,484.17 | £104.26 | 4.38% | 2.99% |
| Stroud | £2,369.37 | £2,491.36 | £121.99 | 5.15% | 2.99% |
| Sunderland | £2,092.79 | £2,197.14 | £104.35 | 4.99% | 4.50% |
| Surrey Heath | £2,467.86 | £2,585.16 | £117.30 | 4.75% | 2.97% |
| Sutton | £2,269.72 | £2,378.64 | £108.92 | 4.80% | 4.99% |
| Swale | £2,305.72 | £2,405.65 | £99.93 | 4.33% | 2.96% |
| Swindon | £2,317.63 | £2,438.10 | £120.47 | 5.20% | 4.99% |
| Tameside | £2,311.80 | £2,447.21 | £135.41 | 5.86% | 4.99% |
| Tamworth | £2,209.81 | £2,300.76 | £90.95 | 4.12% | 2.99% |
| Tandridge | £2,471.62 | £2,594.85 | £123.23 | 4.99% | 2.99% |
| Teignbridge | £2,512.83 | £2,643.12 | £130.29 | 5.18% | 2.99% |
| Telford and Wrekin | £2,146.19 | £2,256.26 | £110.07 | 5.13% | 4.99% |
| Tendring | £2,178.46 | £2,269.63 | £91.17 | 4.19% | 2.99% |
| Test Valley | £2,196.53 | £2,305.52 | £108.99 | 4.96% | 2.94% |
| Tewkesbury | £2,226.55 | £2,340.53 | £113.98 | 5.12% | 3.35% |
| Thanet | £2,391.23 | £2,490.90 | £99.67 | 4.17% | 2.99% |
| Three Rivers | £2,306.47 | £2,422.31 | £115.84 | 5.02% | 2.99% |
| Thurrock | £2,145.06 | £2,254.68 | £109.62 | 5.11% | 4.99% |
| Tonbridge and Malling | £2,374.77 | £2,471.83 | £97.06 | 4.09% | 3.00% |
| Torbay | £2,350.64 | £2,470.25 | £119.61 | 5.09% | 4.99% |
| Torridge | £2,479.12 | £2,601.42 | £122.30 | 4.93% | 2.99% |
| Tower Hamlets | £1,754.57 | £1,837.78 | £83.21 | 4.74% | 4.99% |
| Trafford | £2,122.54 | £2,291.70 | £169.16 | 7.97% | 7.49% |
| Tunbridge Wells | £2,347.20 | £2,446.15 | £98.95 | 4.22% | 2.79% |
| Uttlesford | £2,237.45 | £2,333.82 | £96.37 | 4.31% | 2.99% |
| Vale of White Horse | £2,456.82 | £2,577.44 | £120.62 | 4.91% | 3.09% |
| Wakefield | £2,185.93 | £2,296.89 | £110.96 | 5.08% | 4.99% |
| Walsall | £2,498.27 | £2,627.48 | £129.21 | 5.17% | 4.99% |
| Waltham Forest | £2,277.65 | £2,386.96 | £109.31 | 4.80% | 4.99% |
| Wandsworth | £997.75 | £1,028.21 | £30.46 | 3.05% | 2.04% |
| Warrington | £2,281.40 | £2,447.61 | £166.21 | 7.29% | 7.48% |
| Warwick | £2,356.53 | £2,461.55 | £105.02 | 4.46% | 2.99% |
| Watford | £2,343.38 | £2,446.70 | £103.32 | 4.41% | 0.00% |
| Waverley | £2,483.85 | £2,604.87 | £121.02 | 4.87% | 2.99% |
| Wealden | £2,608.44 | £2,728.43 | £119.99 | 4.60% | 0.00% |
| Welwyn Hatfield | £2,333.46 | £2,452.26 | £118.80 | 5.09% | 2.98% |
| West Berkshire | £2,382.84 | £2,505.37 | £122.53 | 5.14% | 4.99% |
| West Devon | £2,574.29 | £2,705.33 | £131.04 | 5.09% | 2.99% |
| West Lancashire | £2,362.12 | £2,456.23 | £94.11 | 3.98% | 2.99% |
| West Lindsey | £2,279.77 | £2,354.25 | £74.48 | 3.27% | 2.97% |
| West Northamptonshire | £2,362.51 | £2,486.66 | £124.15 | 5.26% | 4.95% |
| West Oxfordshire | £2,443.88 | £2,566.95 | £123.07 | 5.04% | 3.86% |
| West Suffolk | £2,243.00 | £2,351.47 | £108.47 | 4.84% | 2.96% |
| Westminster | £1,019.00 | £1,049.55 | £30.55 | 3.00% | 1.99% |
| Westmorland and Furness | £2,389.00 | £2,507.99 | £118.99 | 4.98% | 4.99% |
| Wigan | £2,031.28 | £2,152.68 | £121.40 | 5.98% | 4.99% |
| Wiltshire | £2,443.40 | £2,571.78 | £128.38 | 5.25% | 4.99% |
| Winchester | £2,251.22 | £2,359.76 | £108.54 | 4.82% | 2.97% |
| Windsor and Maidenhead | £1,823.50 | £1,952.62 | £129.12 | 7.08% | 7.48% |
| Wirral | £2,381.66 | £2,500.59 | £118.93 | 4.99% | 4.99% |
| Woking | £2,482.03 | £2,598.04 | £116.01 | 4.67% | 3.00% |
| Wokingham | £2,376.11 | £2,497.70 | £121.59 | 5.12% | 4.99% |
| Wolverhampton | £2,413.98 | £2,538.99 | £125.01 | 5.18% | 4.99% |
| Worcester | £2,233.93 | £2,405.81 | £171.88 | 7.69% | 2.99% |
| Worthing | £2,343.12 | £2,456.13 | £113.01 | 4.82% | 2.97% |
| Wychavon | £2,200.98 | £2,373.19 | £172.21 | 7.82% | 0.00% |
| Wyre | £2,365.73 | £2,460.53 | £94.80 | 4.01% | 2.99% |
| Wyre Forest | £2,327.49 | £2,512.47 | £184.98 | 7.95% | 2.99% |
| York | £2,175.05 | £2,287.15 | £112.10 | 5.15% | 4.99% |
Source: MHCLG source editions 2024/25, 2025/26 and 2026/27. Calculated percentage = (later charge − earlier charge) ÷ earlier charge × 100. Figures are nominal, before discounts. Missing figures are not carried forward.
How much could a council raise council tax without a referendum in 2026/27?
A council that sets an increase in its own share above the limit for the year must hold a local referendum. The principles for 2026/27, as MHCLG's technical notes set them out, are quoted below. Rows for councils with a different limit carry MHCLG's note saying so.
Authorities are required to hold a referendum if their relevant basic amount of council tax for 2026-27 is in excess of the council tax referendum principles which apply to them. The referendum principles are: 5% or more than 5% (comprising up to a maximum of 2% for expenditure on adult social care and 3% on other expenditure) for authorities with responsibility for adult social care services, except for: Bournemouth, Christchurch and Poole Council who have a maximum of 6.75% (comprising of 2% on adult social care, and 4.75% on other expenditure), Trafford Council, Warrington Borough Council, and Royal Borough of Windsor and Maidenhead Council who have a maximum of 7.5% (comprising of 2% on adult social care, and 5.5% on other expenditure), North Somerset Council, Shropshire Council, and Worcestershire County Council who have a maximum of 9% (comprising of 2% on adult social care, and 7% on other expenditure). More than £5, or 3% or more than 3%, (the greater of the two) for district councils in two tier areas. More than £15 for Police and Crime Commissioners, except for: The Police and Crime Commissioners for Bedfordshire, Cheshire, Durham, Gloucestershire, Humberside, and Northumbria who have a maximum of £18.50. More than £15 for the police component of the Greater Manchester Combined Authority, South Yorkshire Mayoral Combined Authority, West Yorkshire Combined Authority, and York and North Yorkshire Combined Authority precepts. More than £5 for fire and rescue authorities, except for: Northamptonshire Commissioner Fire and Rescue Authority who have a maximum of £10. More than £20.13 for the adjusted relevant basic amount of council tax of the GLA. More than £5.13 for the unadjusted relevant basic amount of council tax of the GLA. No referendum principles were set for mayoral combined authorities or local precepting authorities (parish or town councils, chairmen of parish meetings, charter trustees and the treasurers of the Inner and Middle Temples of London).
Source: MHCLG, Council Tax levels set by local authorities in England 2026 to 2027: Technical Notes, section 5.27, published 25 March 2026.
How much did London boroughs, metropolitan districts and unitary authorities raise their share in 2026/27?
Largest first. The council's own Band D excludes parish precepts and the other bodies' shares.
Show London boroughs, metropolitan districts and unitary authorities: own share percentage changes, 2026/27
The figures as a table
| Area or service | Published own share percentage change |
|---|---|
| North Somerset | 8.99% |
| Shropshire | 8.99% |
| Trafford | 7.49% |
| Warrington | 7.48% |
| Windsor and Maidenhead | 7.48% |
| Bournemouth, Christchurch and Poole | 6.74% |
| Leeds | 5.00% |
| Leicester | 5.00% |
| Barking and Dagenham | 4.99% |
| Bath and North East Somerset | 4.99% |
| Bedford | 4.99% |
| Bexley | 4.99% |
| Birmingham | 4.99% |
| Blackburn with Darwen | 4.99% |
| Blackpool | 4.99% |
| Bolton | 4.99% |
| Bracknell Forest | 4.99% |
| Bradford | 4.99% |
| Brent | 4.99% |
| Brighton and Hove | 4.99% |
| Bristol | 4.99% |
| Bromley | 4.99% |
| Buckinghamshire | 4.99% |
| Bury | 4.99% |
| Calderdale | 4.99% |
| Camden | 4.99% |
| Central Bedfordshire | 4.99% |
| Cheshire East | 4.99% |
| Cheshire West and Chester | 4.99% |
| City of London | 4.99% |
| Cornwall | 4.99% |
| Croydon | 4.99% |
| Cumberland | 4.99% |
| Darlington | 4.99% |
| Derby | 4.99% |
| Dorset | 4.99% |
| Dudley | 4.99% |
| Ealing | 4.99% |
| East Riding of Yorkshire | 4.99% |
| Enfield | 4.99% |
| Gateshead | 4.99% |
| Greenwich | 4.99% |
| Hackney | 4.99% |
| Halton | 4.99% |
| Hammersmith and Fulham | 4.99% |
| Haringey | 4.99% |
| Harrow | 4.99% |
| Havering | 4.99% |
| Herefordshire | 4.99% |
| Hillingdon | 4.99% |
| Hounslow | 4.99% |
| Isle of Wight | 4.99% |
| Isles of Scilly | 4.99% |
| Islington | 4.99% |
| Kensington and Chelsea | 4.99% |
| Kingston upon Hull | 4.99% |
| Kingston upon Thames | 4.99% |
| Kirklees | 4.99% |
| Knowsley | 4.99% |
| Lambeth | 4.99% |
| Lewisham | 4.99% |
| Liverpool | 4.99% |
| Luton | 4.99% |
| Manchester | 4.99% |
| Medway | 4.99% |
| Milton Keynes | 4.99% |
| Newcastle upon Tyne | 4.99% |
| Newham | 4.99% |
| North Northamptonshire | 4.99% |
| North Tyneside | 4.99% |
| North Yorkshire | 4.99% |
| Northumberland | 4.99% |
| Oldham | 4.99% |
| Peterborough | 4.99% |
| Plymouth | 4.99% |
| Portsmouth | 4.99% |
| Reading | 4.99% |
| Redbridge | 4.99% |
| Redcar and Cleveland | 4.99% |
| Richmond upon Thames | 4.99% |
| Rochdale | 4.99% |
| Salford | 4.99% |
| Sandwell | 4.99% |
| Sefton | 4.99% |
| Sheffield | 4.99% |
| Slough | 4.99% |
| Solihull | 4.99% |
| South Gloucestershire | 4.99% |
| Southampton | 4.99% |
| Southend-on-Sea | 4.99% |
| Southwark | 4.99% |
| St Helens | 4.99% |
| Stockport | 4.99% |
| Stoke-on-Trent | 4.99% |
| Sutton | 4.99% |
| Swindon | 4.99% |
| Tameside | 4.99% |
| Telford and Wrekin | 4.99% |
| Thurrock | 4.99% |
| Torbay | 4.99% |
| Tower Hamlets | 4.99% |
| Wakefield | 4.99% |
| Walsall | 4.99% |
| Waltham Forest | 4.99% |
| West Berkshire | 4.99% |
| Westmorland and Furness | 4.99% |
| Wigan | 4.99% |
| Wiltshire | 4.99% |
| Wirral | 4.99% |
| Wokingham | 4.99% |
| Wolverhampton | 4.99% |
| York | 4.99% |
| Barnet | 4.98% |
| Somerset | 4.98% |
| South Tyneside | 4.95% |
| Stockton-on-Tees | 4.95% |
| West Northamptonshire | 4.95% |
| North Lincolnshire | 4.68% |
| North East Lincolnshire | 4.50% |
| Sunderland | 4.50% |
| Coventry | 3.95% |
| Rotherham | 3.95% |
| Nottingham | 3.50% |
| Barnsley | 3.40% |
| Wandsworth | 2.04% |
| Merton | 2.01% |
| Doncaster | 2.00% |
| Middlesbrough | 2.00% |
| Rutland | 2.00% |
| Durham | 1.99% |
| Westminster | 1.99% |
| Hartlepool | 1.98% |
| Source: MHCLG, Council Tax levels set by local authorities in England 2026 to 2027, Table 8a, 25 March 2026. | |
Source: MHCLG, Council Tax levels set by local authorities in England 2026 to 2027, Table 8a, published 25 March 2026.

| Council | Own Band D | Change | Note |
|---|---|---|---|
| North Somerset | £1,955.01 | 8.99% | For 2026-27, North Somerset Council and Shropshire Council could increase their council tax by up to 9% (7% core and 2% adult social care) without the need for a referendum. |
| Shropshire | £1,969.09 | 8.99% | For 2026-27, North Somerset Council and Shropshire Council could increase their council tax by up to 9% (7% core and 2% adult social care) without the need for a referendum. |
| Trafford | £1,850.54 | 7.49% | For 2026-27, Trafford Council, Warrington Borough Council and the Royal Borough of Windsor and Maidenhead Council could increase their council tax by up to 7.5% (5.5% core and 2% adult social care) without the need for a referendum. |
| Warrington | £2,007.50 | 7.48% | For 2026-27, Trafford Council, Warrington Borough Council and the Royal Borough of Windsor and Maidenhead Council could increase their council tax by up to 7.5% (5.5% core and 2% adult social care) without the need for a referendum. |
| Windsor and Maidenhead | £1,526.63 | 7.48% | For 2026-27, Trafford Council, Warrington Borough Council and the Royal Borough of Windsor and Maidenhead Council could increase their council tax by up to 7.5% (5.5% core and 2% adult social care) without the need for a referendum. |
| Bournemouth, Christchurch and Poole | £1,980.46 | 6.74% | For 2026-27, Bournemouth, Christchurch and Poole Council could increase their council tax by up to 6.75% (4.75% core and 2% adult social care) without the need for a referendum. |
| Leeds | £1,903.74 | 5.00% | The increase in average council tax including adult social care and excluding parish precepts for this authority is showing as 5% due to rounding to 2 decimal places. It is not exceeding referendum principles as the actual percentage change is below the threshold. |
| Leicester | £2,121.87 | 5.00% | The increase in average council tax including adult social care and excluding parish precepts for this authority is showing as 5% due to rounding to 2 decimal places. It is not exceeding referendum principles as the actual percentage change is below the threshold. |
| Barking and Dagenham | £1,688.00 | 4.99% | |
| Bath and North East Somerset | £1,914.03 | 4.99% | |
| Bedford | £2,011.28 | 4.99% | |
| Bexley | £1,855.85 | 4.99% | |
| Birmingham | £2,023.48 | 4.99% | |
| Blackburn with Darwen | £2,062.96 | 4.99% | |
| Blackpool | £2,126.09 | 4.99% | |
| Bolton | £1,953.08 | 4.99% | |
| Bracknell Forest | £1,781.46 | 4.99% | |
| Bradford | £1,965.28 | 4.99% | |
| Brent | £1,724.76 | 4.99% | |
| Brighton and Hove | £2,180.42 | 4.99% | |
| Bristol | £2,310.05 | 4.99% | |
| Bromley | £1,629.53 | 4.99% | |
| Buckinghamshire | £2,037.50 | 4.99% | |
| Bury | £2,115.90 | 4.99% | |
| Calderdale | £2,034.19 | 4.99% | |
| Camden | £1,697.04 | 4.99% | |
| Central Bedfordshire | £1,931.54 | 4.99% | |
| Cheshire East | £1,975.95 | 4.99% | |
| Cheshire West and Chester | £2,076.79 | 4.99% | |
| City of London | £1,112.38 | 4.99% | |
| Cornwall | £2,086.36 | 4.99% | |
| Croydon | £2,089.40 | 4.99% | |
| Cumberland | £2,002.64 | 4.99% | |
| Darlington | £2,056.87 | 4.99% | |
| Derby | £1,898.99 | 4.99% | |
| Dorset | £2,205.90 | 4.99% | |
| Dudley | £1,815.15 | 4.99% | |
| Ealing | £1,628.02 | 4.99% | |
| East Riding of Yorkshire | £1,968.90 | 4.99% | |
| Enfield | £1,757.16 | 4.99% | |
| Gateshead | £2,396.07 | 4.99% | |
| Greenwich | £1,597.35 | 4.99% | |
| Hackney | £1,549.79 | 4.99% | |
| Halton | £1,938.81 | 4.99% | |
| Hammersmith and Fulham | £1,009.00 | 4.99% | |
| Haringey | £1,803.27 | 4.99% | |
| Harrow | £2,000.56 | 4.99% | |
| Havering | £1,914.15 | 4.99% | |
| Herefordshire | £2,067.64 | 4.99% | |
| Hillingdon | £1,534.95 | 4.99% | |
| Hounslow | £1,675.05 | 4.99% | |
| Isle of Wight | £2,103.77 | 4.99% | |
| Isles of Scilly | £1,744.76 | 4.99% | |
| Islington | £1,597.64 | 4.99% | |
| Kensington and Chelsea | £1,156.14 | 4.99% | |
| Kingston upon Hull | £1,873.46 | 4.99% | |
| Kingston upon Thames | £2,098.69 | 4.99% | |
| Kirklees | £2,062.42 | 4.99% | |
| Knowsley | £2,028.94 | 4.99% | |
| Lambeth | £1,536.60 | 4.99% | |
| Lewisham | £1,726.82 | 4.99% | |
| Liverpool | £2,254.37 | 4.99% | |
| Luton | £2,019.62 | 4.99% | |
| Manchester | £1,872.79 | 4.99% | |
| Medway | £1,934.33 | 4.99% | |
| Milton Keynes | £1,847.53 | 4.99% | |
| Newcastle upon Tyne | £2,221.21 | 4.99% | |
| Newham | £1,433.72 | 4.99% | |
| North Northamptonshire | £1,918.23 | 4.99% | |
| North Tyneside | £2,142.32 | 4.99% | |
| North Yorkshire | £2,036.32 | 4.99% | |
| Northumberland | £2,279.36 | 4.99% | |
| Oldham | £2,156.22 | 4.99% | |
| Peterborough | £1,836.72 | 4.99% | |
| Plymouth | £2,028.97 | 4.99% | |
| Portsmouth | £1,908.41 | 4.99% | |
| Reading | £2,223.18 | 4.99% | |
| Redbridge | £1,784.07 | 4.99% | |
| Redcar and Cleveland | £2,094.03 | 4.99% | |
| Richmond upon Thames | £1,975.59 | 4.99% | |
| Rochdale | £2,161.58 | 4.99% | |
| Salford | £2,155.20 | 4.99% | |
| Sandwell | £1,914.77 | 4.99% | |
| Sefton | £2,145.51 | 4.99% | |
| Sheffield | £2,130.23 | 4.99% | |
| Slough | £2,019.05 | 4.99% | |
| Solihull | £1,843.27 | 4.99% | |
| South Gloucestershire | £2,027.71 | 4.99% | |
| Southampton | £1,998.18 | 4.99% | |
| Southend-on-Sea | £1,888.47 | 4.99% | |
| Southwark | £1,456.75 | 4.99% | |
| St Helens | £1,975.65 | 4.99% | |
| Stockport | £2,179.65 | 4.99% | |
| Stoke-on-Trent | £1,783.78 | 4.99% | |
| Sutton | £1,868.13 | 4.99% | |
| Swindon | £1,866.50 | 4.99% | |
| Tameside | £2,007.38 | 4.99% | |
| Telford and Wrekin | £1,694.19 | 4.99% | |
| Thurrock | £1,886.85 | 4.99% | |
| Torbay | £2,044.11 | 4.99% | |
| Tower Hamlets | £1,327.27 | 4.99% | |
| Wakefield | £1,891.63 | 4.99% | |
| Walsall | £2,297.79 | 4.99% | |
| Waltham Forest | £1,876.45 | 4.99% | |
| West Berkshire | £2,017.32 | 4.99% | |
| Westmorland and Furness | £2,014.73 | 4.99% | |
| Wigan | £1,712.29 | 4.99% | |
| Wiltshire | £1,981.15 | 4.99% | |
| Wirral | £2,081.37 | 4.99% | |
| Wokingham | £2,027.40 | 4.99% | |
| Wolverhampton | £2,209.30 | 4.99% | |
| York | £1,817.43 | 4.99% | |
| Barnet | £1,622.09 | 4.98% | |
| Somerset | £1,950.89 | 4.98% | |
| South Tyneside | £2,114.98 | 4.95% | |
| Stockton-on-Tees | £2,139.91 | 4.95% | |
| West Northamptonshire | £1,959.40 | 4.95% | |
| North Lincolnshire | £1,884.70 | 4.68% | |
| North East Lincolnshire | £2,039.88 | 4.50% | |
| Sunderland | £1,876.80 | 4.50% | |
| Coventry | £2,186.40 | 3.95% | |
| Rotherham | £1,944.52 | 3.95% | |
| Nottingham | £2,342.08 | 3.50% | |
| Barnsley | £1,942.29 | 3.40% | |
| Wandsworth | £517.70 | 2.04% | |
| Merton | £1,636.25 | 2.01% | |
| Doncaster | £1,749.86 | 2.00% | |
| Middlesbrough | £2,115.86 | 2.00% | |
| Rutland | £2,263.33 | 2.00% | |
| Durham | £2,071.11 | 1.99% | |
| Westminster | £537.74 | 1.99% | |
| Hartlepool | £2,124.69 | 1.98% |
Source: MHCLG, Council Tax levels set by local authorities in England 2026 to 2027, Table 8a, published 25 March 2026.
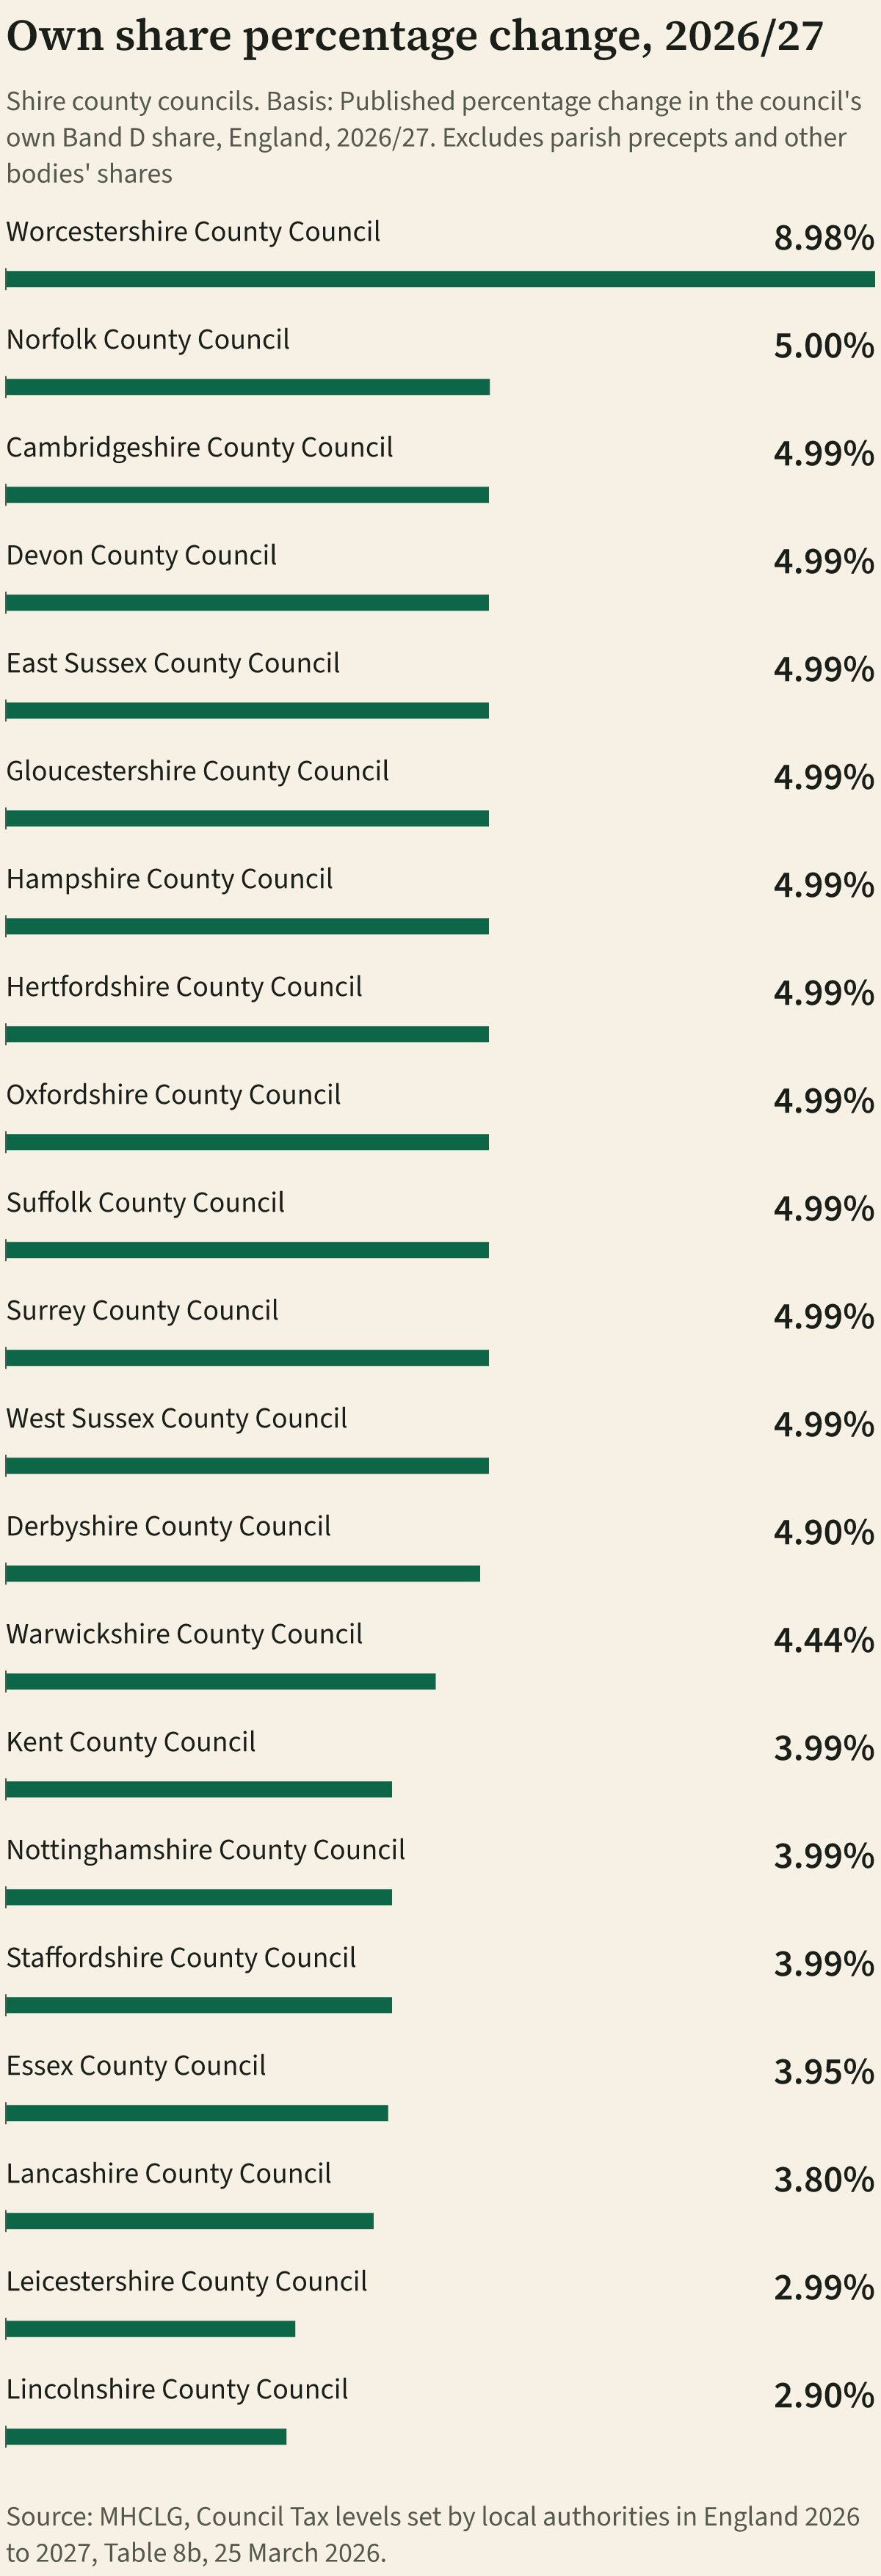
How much did county councils raise their share in 2026/27?
Largest first. The council's own Band D excludes parish precepts and the other bodies' shares.
The figures as a table
| Area or service | Published own share percentage change |
|---|---|
| Worcestershire County Council | 8.98% |
| Norfolk County Council | 5.00% |
| Cambridgeshire County Council | 4.99% |
| Devon County Council | 4.99% |
| East Sussex County Council | 4.99% |
| Gloucestershire County Council | 4.99% |
| Hampshire County Council | 4.99% |
| Hertfordshire County Council | 4.99% |
| Oxfordshire County Council | 4.99% |
| Suffolk County Council | 4.99% |
| Surrey County Council | 4.99% |
| West Sussex County Council | 4.99% |
| Derbyshire County Council | 4.90% |
| Warwickshire County Council | 4.44% |
| Kent County Council | 3.99% |
| Nottinghamshire County Council | 3.99% |
| Staffordshire County Council | 3.99% |
| Essex County Council | 3.95% |
| Lancashire County Council | 3.80% |
| Leicestershire County Council | 2.99% |
| Lincolnshire County Council | 2.90% |
| Source: MHCLG, Council Tax levels set by local authorities in England 2026 to 2027, Table 8b, 25 March 2026. | |
Source: MHCLG, Council Tax levels set by local authorities in England 2026 to 2027, Table 8b, published 25 March 2026.
| Council | Own Band D | Change | Note |
|---|---|---|---|
| Worcestershire County Council | £1,760.80 | 8.98% | For 2026-27, Worcestershire County Council could increase their council tax by up to 9% (7% core and 2% adult social care) without the need for a referendum. |
| Norfolk County Council | £1,843.38 | 5.00% | The increase in average council tax including adult social care and excluding parish precepts for this authority is showing as 5% due to rounding to 2 decimal places. It is not exceeding referendum principles as the actual percentage change is below the threshold. |
| Cambridgeshire County Council | £1,785.42 | 4.99% | |
| Devon County Council | £1,891.17 | 4.99% | |
| East Sussex County Council | £1,960.29 | 4.99% | |
| Gloucestershire County Council | £1,763.46 | 4.99% | |
| Hampshire County Council | £1,690.11 | 4.99% | |
| Hertfordshire County Council | £1,858.19 | 4.99% | |
| Oxfordshire County Council | £2,006.78 | 4.99% | |
| Suffolk County Council | £1,731.69 | 4.99% | |
| Surrey County Council | £1,938.42 | 4.99% | |
| West Sussex County Council | £1,890.36 | 4.99% | |
| Derbyshire County Council | £1,708.99 | 4.90% | |
| Warwickshire County Council | £1,903.86 | 4.44% | |
| Kent County Council | £1,758.60 | 3.99% | |
| Nottinghamshire County Council | £1,970.13 | 3.99% | |
| Staffordshire County Council | £1,686.42 | 3.99% | |
| Essex County Council | £1,641.96 | 3.95% | |
| Lancashire County Council | £1,801.75 | 3.80% | |
| Leicestershire County Council | £1,731.79 | 2.99% | |
| Lincolnshire County Council | £1,673.01 | 2.90% |
Source: MHCLG, Council Tax levels set by local authorities in England 2026 to 2027, Table 8b, published 25 March 2026.
How much did district councils raise their share in 2026/27?
Largest first. The council's own Band D excludes parish precepts and the other bodies' shares.
Show Shire district councils: own share percentage changes, 2026/27
The figures as a table
| Area or service | Published own share percentage change |
|---|---|
| Breckland | 4.14% |
| West Oxfordshire | 3.86% |
| South Staffordshire | 3.44% |
| Basingstoke and Deane | 3.41% |
| Tewkesbury | 3.35% |
| South Oxfordshire | 3.31% |
| East Hampshire | 3.29% |
| Cherwell | 3.15% |
| Cotswold | 3.15% |
| Vale of White Horse | 3.09% |
| Broxbourne | 3.06% |
| Huntingdonshire | 3.01% |
| Elmbridge | 3.00% |
| Mid Devon | 3.00% |
| Rushmoor | 3.00% |
| Tonbridge and Malling | 3.00% |
| Woking | 3.00% |
| Adur | 2.99% |
| Amber Valley | 2.99% |
| Arun | 2.99% |
| Ashford | 2.99% |
| Babergh | 2.99% |
| Bassetlaw | 2.99% |
| Blaby | 2.99% |
| Bolsover | 2.99% |
| Boston | 2.99% |
| Brentwood | 2.99% |
| Bromsgrove | 2.99% |
| Cambridge | 2.99% |
| Cannock Chase | 2.99% |
| Canterbury | 2.99% |
| Cheltenham | 2.99% |
| Chesterfield | 2.99% |
| Chichester | 2.99% |
| Colchester | 2.99% |
| Crawley | 2.99% |
| Dacorum | 2.99% |
| Derbyshire Dales | 2.99% |
| East Devon | 2.99% |
| East Lindsey | 2.99% |
| Eastbourne | 2.99% |
| Exeter | 2.99% |
| Fareham | 2.99% |
| Folkestone and Hythe | 2.99% |
| Forest of Dean | 2.99% |
| Fylde | 2.99% |
| Gedling | 2.99% |
| Gloucester | 2.99% |
| Gosport | 2.99% |
| Gravesham | 2.99% |
| Great Yarmouth | 2.99% |
| Guildford | 2.99% |
| Hart | 2.99% |
| Hastings | 2.99% |
| Hertsmere | 2.99% |
| High Peak | 2.99% |
| Kings Lynn and West Norfolk | 2.99% |
| Lancaster | 2.99% |
| Lewes | 2.99% |
| Maldon | 2.99% |
| Mansfield | 2.99% |
| Melton | 2.99% |
| Mid Suffolk | 2.99% |
| Mole Valley | 2.99% |
| New Forest | 2.99% |
| North Devon | 2.99% |
| North East Derbyshire | 2.99% |
| North Hertfordshire | 2.99% |
| Norwich | 2.99% |
| Nuneaton and Bedworth | 2.99% |
| Oxford | 2.99% |
| Pendle | 2.99% |
| Preston | 2.99% |
| Redditch | 2.99% |
| Rossendale | 2.99% |
| Rugby | 2.99% |
| Runnymede | 2.99% |
| South Cambridgeshire | 2.99% |
| South Derbyshire | 2.99% |
| South Hams | 2.99% |
| South Kesteven | 2.99% |
| St Albans | 2.99% |
| Stafford | 2.99% |
| Stevenage | 2.99% |
| Stratford-on-Avon | 2.99% |
| Stroud | 2.99% |
| Tamworth | 2.99% |
| Tandridge | 2.99% |
| Teignbridge | 2.99% |
| Tendring | 2.99% |
| Thanet | 2.99% |
| Three Rivers | 2.99% |
| Torridge | 2.99% |
| Uttlesford | 2.99% |
| Warwick | 2.99% |
| Waverley | 2.99% |
| West Devon | 2.99% |
| West Lancashire | 2.99% |
| Worcester | 2.99% |
| Wyre | 2.99% |
| Wyre Forest | 2.99% |
| Castle Point | 2.98% |
| Dover | 2.98% |
| East Hertfordshire | 2.98% |
| Epping Forest | 2.98% |
| Epsom and Ewell | 2.98% |
| Ipswich | 2.98% |
| Maidstone | 2.98% |
| Sevenoaks | 2.98% |
| Staffordshire Moorlands | 2.98% |
| Welwyn Hatfield | 2.98% |
| Chelmsford | 2.97% |
| Havant | 2.97% |
| Surrey Heath | 2.97% |
| West Lindsey | 2.97% |
| Winchester | 2.97% |
| Worthing | 2.97% |
| North Norfolk | 2.96% |
| South Holland | 2.96% |
| Swale | 2.96% |
| West Suffolk | 2.96% |
| East Suffolk | 2.95% |
| Mid Sussex | 2.95% |
| Test Valley | 2.94% |
| Ashfield | 2.93% |
| Broxtowe | 2.93% |
| Spelthorne | 2.90% |
| South Norfolk | 2.85% |
| East Staffordshire | 2.81% |
| North Kesteven | 2.81% |
| Horsham | 2.80% |
| Tunbridge Wells | 2.79% |
| North West Leicestershire | 2.71% |
| Hinckley and Bosworth | 2.60% |
| Oadby and Wigston | 2.50% |
| Charnwood | 2.31% |
| Burnley | 1.99% |
| Lichfield | 1.99% |
| Newcastle-under-Lyme | 1.99% |
| Rochford | 1.95% |
| South Ribble | 1.90% |
| Rother | 1.31% |
| Rushcliffe | 0.48% |
| Basildon | 0.00% |
| Braintree | 0.00% |
| Chorley | 0.00% |
| Dartford | 0.00% |
| East Cambridgeshire | 0.00% |
| Erewash | 0.00% |
| Harlow | 0.00% |
| Hyndburn | 0.00% |
| Lincoln | 0.00% |
| Malvern Hills | 0.00% |
| Newark and Sherwood | 0.00% |
| North Warwickshire | 0.00% |
| Reigate and Banstead | 0.00% |
| Ribble Valley | 0.00% |
| Watford | 0.00% |
| Wealden | 0.00% |
| Wychavon | 0.00% |
| Broadland | -0.31% |
| Fenland | -0.57% |
| Harborough | -5.00% |
| Eastleigh | -8.39% |
| Source: MHCLG, Council Tax levels set by local authorities in England 2026 to 2027, Table 8c, 25 March 2026. | |
Source: MHCLG, Council Tax levels set by local authorities in England 2026 to 2027, Table 8c, published 25 March 2026.

| Council | Own Band D | Change | In pounds | Note |
|---|---|---|---|---|
| Breckland | £125.45 | 4.14% | £4.99 | |
| West Oxfordshire | £134.38 | 3.86% | £5.00 | |
| South Staffordshire | £150.34 | 3.44% | £5.00 | |
| Basingstoke and Deane | £151.42 | 3.41% | £5.00 | |
| Tewkesbury | £154.36 | 3.35% | £5.00 | |
| South Oxfordshire | £156.24 | 3.31% | £5.00 | |
| East Hampshire | £156.92 | 3.29% | £5.00 | |
| Cherwell | £163.50 | 3.15% | £5.00 | |
| Cotswold | £163.93 | 3.15% | £5.00 | |
| Vale of White Horse | £166.69 | 3.09% | £5.00 | |
| Broxbourne | £168.24 | 3.06% | £5.00 | |
| Huntingdonshire | £170.85 | 3.01% | £4.99 | |
| Elmbridge | £265.88 | 3.00% | £7.74 | The increase in average council tax including adult social care and excluding parish precepts for this authority is showing as 3% due to rounding to 2 decimal places. It is not exceeding referendum principles as the actual percentage change is below the threshold. |
| Mid Devon | £246.29 | 3.00% | £7.17 | The increase in average council tax including adult social care and excluding parish precepts for this authority is showing as 3% due to rounding to 2 decimal places. It is not exceeding referendum principles as the actual percentage change is below the threshold. |
| Rushmoor | £246.87 | 3.00% | £7.18 | The increase in average council tax including adult social care and excluding parish precepts for this authority is showing as 3% due to rounding to 2 decimal places. It is not exceeding referendum principles as the actual percentage change is below the threshold. |
| Tonbridge and Malling | £252.65 | 3.00% | £7.35 | The increase in average council tax including adult social care and excluding parish precepts for this authority is showing as 3% due to rounding to 2 decimal places. It is not exceeding referendum principles as the actual percentage change is below the threshold. |
| Woking | £307.05 | 3.00% | £8.94 | The increase in average council tax including adult social care and excluding parish precepts for this authority is showing as 3% due to rounding to 2 decimal places. It is not exceeding referendum principles as the actual percentage change is below the threshold. |
| Adur | £353.99 | 2.99% | £10.28 | |
| Amber Valley | £203.77 | 2.99% | £5.92 | |
| Arun | £221.04 | 2.99% | £6.42 | |
| Ashford | £199.37 | 2.99% | £5.79 | |
| Babergh | £199.52 | 2.99% | £5.79 | |
| Bassetlaw | £212.05 | 2.99% | £6.15 | |
| Blaby | £200.62 | 2.99% | £5.83 | |
| Bolsover | £215.20 | 2.99% | £6.25 | |
| Boston | £269.37 | 2.99% | £7.82 | |
| Brentwood | £223.49 | 2.99% | £6.49 | |
| Bromsgrove | £265.18 | 2.99% | £7.70 | |
| Cambridge | £239.07 | 2.99% | £6.94 | |
| Cannock Chase | £258.81 | 2.99% | £7.51 | |
| Canterbury | £254.43 | 2.99% | £7.38 | |
| Cheltenham | £252.11 | 2.99% | £7.32 | |
| Chesterfield | £202.39 | 2.99% | £5.88 | |
| Chichester | £197.80 | 2.99% | £5.74 | |
| Colchester | £231.15 | 2.99% | £6.71 | |
| Crawley | £246.19 | 2.99% | £7.15 | |
| Dacorum | £243.21 | 2.99% | £7.06 | |
| Derbyshire Dales | £251.37 | 2.99% | £7.30 | |
| East Devon | £176.92 | 2.99% | £5.14 | |
| East Lindsey | £176.67 | 2.99% | £5.13 | |
| Eastbourne | £294.59 | 2.99% | £8.55 | |
| Exeter | £191.31 | 2.99% | £5.55 | |
| Fareham | £197.14 | 2.99% | £5.72 | |
| Folkestone and Hythe | £313.92 | 2.99% | £9.11 | |
| Forest of Dean | £218.29 | 2.99% | £6.34 | |
| Fylde | £239.11 | 2.99% | £6.94 | |
| Gedling | £200.32 | 2.99% | £5.82 | |
| Gloucester | £244.13 | 2.99% | £7.09 | |
| Gosport | £270.88 | 2.99% | £7.87 | |
| Gravesham | £245.07 | 2.99% | £7.11 | |
| Great Yarmouth | £198.25 | 2.99% | £5.76 | |
| Guildford | £210.19 | 2.99% | £6.10 | |
| Hart | £210.20 | 2.99% | £6.10 | |
| Hastings | £316.89 | 2.99% | £9.20 | |
| Hertsmere | £216.34 | 2.99% | £6.28 | |
| High Peak | £230.89 | 2.99% | £6.70 | |
| Kings Lynn and West Norfolk | £174.19 | 2.99% | £5.06 | |
| Lancaster | £272.20 | 2.99% | £7.90 | |
| Lewes | £242.02 | 2.99% | £7.03 | The average (band D 2 adult equivalent) council tax including local precepts for one authority (Lewes District Council) for 2026-27 is pending approval subject to a full council decision on 26 March 2026. |
| Maldon | £238.95 | 2.99% | £6.94 | |
| Mansfield | £212.72 | 2.99% | £6.18 | |
| Melton | £244.88 | 2.99% | £7.12 | |
| Mid Suffolk | £180.26 | 2.99% | £5.23 | |
| Mole Valley | £217.59 | 2.99% | £6.31 | |
| New Forest | £211.92 | 2.99% | £6.15 | |
| North Devon | £223.16 | 2.99% | £6.48 | |
| North East Derbyshire | £223.15 | 2.99% | £6.48 | |
| North Hertfordshire | £275.79 | 2.99% | £8.01 | |
| Norwich | £315.26 | 2.99% | £9.15 | |
| Nuneaton and Bedworth | £279.59 | 2.99% | £8.12 | |
| Oxford | £367.38 | 2.99% | £10.66 | |
| Pendle | £316.71 | 2.99% | £9.19 | |
| Preston | £375.34 | 2.99% | £10.89 | |
| Redditch | £285.94 | 2.99% | £8.30 | |
| Rossendale | £327.16 | 2.99% | £9.50 | |
| Rugby | £230.32 | 2.99% | £6.69 | |
| Runnymede | £202.00 | 2.99% | £5.86 | |
| South Cambridgeshire | £180.64 | 2.99% | £5.24 | |
| South Derbyshire | £190.78 | 2.99% | £5.54 | |
| South Hams | £202.54 | 2.99% | £5.88 | |
| South Kesteven | £195.03 | 2.99% | £5.66 | |
| St Albans | £214.22 | 2.99% | £6.22 | |
| Stafford | £184.09 | 2.99% | £5.34 | |
| Stevenage | £253.78 | 2.99% | £7.37 | |
| Stratford-on-Avon | £174.18 | 2.99% | £5.06 | |
| Stroud | £250.35 | 2.99% | £7.27 | |
| Tamworth | £215.00 | 2.99% | £6.24 | |
| Tandridge | £259.86 | 2.99% | £7.54 | |
| Teignbridge | £208.33 | 2.99% | £6.05 | |
| Tendring | £205.48 | 2.99% | £5.96 | |
| Thanet | £279.15 | 2.99% | £8.10 | |
| Three Rivers | £212.53 | 2.99% | £6.17 | |
| Torridge | £201.01 | 2.99% | £5.84 | |
| Uttlesford | £187.46 | 2.99% | £5.44 | |
| Warwick | £193.21 | 2.99% | £5.61 | |
| Waverley | £220.25 | 2.99% | £6.39 | |
| West Devon | £277.46 | 2.99% | £8.05 | |
| West Lancashire | £245.71 | 2.99% | £7.13 | |
| Worcester | £226.01 | 2.99% | £6.56 | |
| Wyre | £240.05 | 2.99% | £6.97 | |
| Wyre Forest | £258.08 | 2.99% | £7.50 | |
| Castle Point | £298.80 | 2.98% | £8.64 | |
| Dover | £227.34 | 2.98% | £6.57 | |
| East Hertfordshire | £207.03 | 2.98% | £5.99 | |
| Epping Forest | £177.12 | 2.98% | £5.13 | |
| Epsom and Ewell | £239.85 | 2.98% | £6.93 | |
| Ipswich | £432.09 | 2.98% | £12.51 | |
| Maidstone | £310.68 | 2.98% | £9.00 | |
| Sevenoaks | £258.48 | 2.98% | £7.47 | |
| Staffordshire Moorlands | £191.50 | 2.98% | £5.54 | |
| Welwyn Hatfield | £252.00 | 2.98% | £7.29 | |
| Chelmsford | £234.85 | 2.97% | £6.78 | |
| Havant | £246.87 | 2.97% | £7.11 | |
| Surrey Heath | £268.07 | 2.97% | £7.74 | |
| West Lindsey | £256.14 | 2.97% | £7.38 | |
| Winchester | £194.10 | 2.97% | £5.59 | |
| Worthing | £283.86 | 2.97% | £8.19 | |
| North Norfolk | £178.65 | 2.96% | £5.13 | |
| South Holland | £222.14 | 2.96% | £6.38 | |
| Swale | £212.76 | 2.96% | £6.12 | |
| West Suffolk | £209.70 | 2.96% | £6.03 | |
| East Suffolk | £197.82 | 2.95% | £5.67 | |
| Mid Sussex | £202.22 | 2.95% | £5.79 | |
| Test Valley | £180.76 | 2.94% | £5.16 | |
| Ashfield | £213.20 | 2.93% | £6.07 | |
| Broxtowe | £199.34 | 2.93% | £5.68 | |
| Spelthorne | £235.50 | 2.90% | £6.64 | |
| South Norfolk | £180.14 | 2.85% | £5.00 | |
| East Staffordshire | £221.80 | 2.81% | £6.07 | |
| North Kesteven | £205.67 | 2.81% | £5.62 | |
| Horsham | £187.71 | 2.80% | £5.12 | |
| Tunbridge Wells | £217.10 | 2.79% | £5.90 | |
| North West Leicestershire | £189.01 | 2.71% | £4.98 | |
| Hinckley and Bosworth | £164.02 | 2.60% | £4.15 | |
| Oadby and Wigston | £268.18 | 2.50% | £6.54 | |
| Charnwood | £177.09 | 2.31% | £3.99 | |
| Burnley | £351.44 | 1.99% | £6.86 | |
| Lichfield | £201.79 | 1.99% | £3.94 | |
| Newcastle-under-Lyme | £227.48 | 1.99% | £4.44 | |
| Rochford | £272.88 | 1.95% | £5.22 | |
| South Ribble | £241.28 | 1.90% | £4.50 | |
| Rother | £234.13 | 1.31% | £3.03 | |
| Rushcliffe | £183.82 | 0.48% | £0.88 | |
| Basildon | £304.56 | 0.00% | £0.00 | |
| Braintree | £206.01 | 0.00% | £0.00 | |
| Chorley | £215.99 | 0.00% | £0.00 | |
| Dartford | £188.64 | 0.00% | £0.00 | |
| East Cambridgeshire | £142.14 | 0.00% | £0.00 | |
| Erewash | £220.22 | 0.00% | £0.00 | |
| Harlow | £288.90 | 0.00% | £0.00 | |
| Hyndburn | £276.46 | 0.00% | £0.00 | |
| Lincoln | £316.98 | 0.00% | £0.00 | |
| Malvern Hills | £182.60 | 0.00% | £0.00 | |
| Newark and Sherwood | £198.60 | 0.00% | £0.00 | |
| North Warwickshire | £242.75 | 0.00% | £0.00 | |
| Reigate and Banstead | £264.87 | 0.00% | £0.00 | |
| Ribble Valley | £170.69 | 0.00% | £0.00 | |
| Watford | £308.51 | 0.00% | £0.00 | |
| Wealden | £221.14 | 0.00% | £0.00 | |
| Wychavon | £128.21 | 0.00% | £0.00 | |
| Broadland | £135.74 | -0.31% | -£0.42 | |
| Fenland | £253.35 | -0.57% | -£1.44 | |
| Harborough | £174.13 | -5.00% | -£9.16 | |
| Eastleigh | £131.71 | -8.39% | -£12.07 |
Source: MHCLG, Council Tax levels set by local authorities in England 2026 to 2027, Table 8c, published 25 March 2026.
How much did council tax go up in 2025/26?
How much did council tax go up in England in 2025/26?
Source: MHCLG, Council Tax levels set by local authorities in England 2025 to 2026, Table 7, published 20 March 2025.
Includes adult social care and average parish precepts.
| Class | Band D | Change on 2024/25 |
|---|---|---|
| England [r] | £2,236 | 5.0% |
| Inner London Boroughs including City | £1,192 | 4.8% |
| Outer London Boroughs | £1,688 | 5.1% |
| London Boroughs | £1,492 | 5.0% |
| Greater London Authority | £490 | 4.0% |
| of which The Mayor's Office for Policing and Crime | £319 | 4.6% |
| of which Other Services | £171 | 3.0% |
| Combined Authorities | £86 | 16.6% |
| Metropolitan Districts | £1,926 | 5.4% |
| Metropolitan Fire and Rescue Authorities | £88 | 6.0% |
| Shire Unitary Authorities [r] | £1,913 | 5.1% |
| Shire Counties | £1,722 | 4.8% |
| Shire Districts [r] | £216 | 2.8% |
| Shire Fire and Rescue Authorities | £95 | 5.6% |
| Police and Crime Commissioners | £282 | 5.2% |
| Fire and Rescue Authorities | £93 | 5.7% |
Source: MHCLG, Council Tax levels set by local authorities in England 2025 to 2026, Table 2, published 20 March 2025.
How much could a council raise council tax without a referendum in 2025/26?
A council that sets an increase in its own share above the limit for the year must hold a local referendum. The principles for 2025/26, as MHCLG's technical notes set them out, are quoted below. Rows for councils with a different limit carry MHCLG's note saying so.
Authorities are required to hold a referendum if their relevant basic amount of council tax for 2025-26 is in excess of the council tax referendum principles which apply to them. The referendum principles are: 5% or more than 5% (comprising up to a maximum of 2% for expenditure on adult social care and 3% on other expenditure) for authorities with responsibility for adult social care services, except for: Birmingham City Council, Somerset Council and Trafford Metropolitan Borough Council who have a maximum of 7.5% (comprising of 2% on adult social care, and 5.5% on other expenditure), Newham London Borough Council and Royal Borough of Windsor and Maidenhead Council who have a maximum of 9% (comprising of 2% on adult social care, and 7% on other expenditure), City of Bradford Metropolitan District Council who have a maximum of 10% (comprising of 2% on adult social care, and 8% on other expenditure). More than £5, or 3% or more than 3%, (the greater of the two) for district councils in 2 tier areas. More than £14 for Police and Crime Commissioners. More than £14 for the police component of the Greater Manchester Combined Authority, South Yorkshire Mayoral Combined Authority, West Yorkshire Combined Authority, and York and North Yorkshire Combined Authority precepts. More than £5 for fire and rescue authorities. More than £18.98 for the adjusted relevant basic amount of council tax of the GLA. More than £4.98 for the unadjusted relevant basic amount of council tax of the GLA. No referendum principles were set for mayoral combined authorities or local precepting authorities (parish or town councils, chairmen of parish meetings, charter trustees and the treasurers of the Inner and Middle Temples of London).
Source: MHCLG, Council Tax levels set by local authorities in England 2025 to 2026: technical notes (revised), section 5.27, published 20 March 2025.
How much did London boroughs, metropolitan districts and unitary authorities raise their share in 2025/26?
Largest first. The council's own Band D excludes parish precepts and the other bodies' shares.
| Council | Own Band D | Change | Note |
|---|---|---|---|
| Bradford | £1,871.88 | 9.99% | |
| Newham | £1,365.58 | 8.99% | |
| Windsor and Maidenhead | £1,420.34 | 8.99% | |
| Birmingham | £1,927.31 | 7.49% | |
| Trafford | £1,721.59 | 7.49% | |
| Somerset | £1,858.32 | 7.46% | |
| Leeds | £1,813.13 | 5.00% | |
| Leicester | £2,020.84 | 5.00% | |
| Thurrock | £1,797.12 | 5.00% | |
| Barking and Dagenham | £1,607.76 | 4.99% | |
| Bath and North East Somerset | £1,823.06 | 4.99% | |
| Bedford | £1,915.69 | 4.99% | |
| Bexley | £1,767.65 | 4.99% | |
| Blackburn with Darwen | £1,964.93 | 4.99% | |
| Blackpool | £2,025.08 | 4.99% | |
| Bolton | £1,860.26 | 4.99% | |
| Bournemouth, Christchurch and Poole | £1,855.41 | 4.99% | |
| Bracknell Forest | £1,696.77 | 4.99% | |
| Brent | £1,642.77 | 4.99% | |
| Brighton and Hove | £2,076.75 | 4.99% | |
| Bristol | £2,200.26 | 4.99% | |
| Bromley | £1,552.08 | 4.99% | |
| Buckinghamshire | £1,940.65 | 4.99% | |
| Bury | £2,015.33 | 4.99% | |
| Calderdale | £1,937.51 | 4.99% | |
| Camden | £1,616.31 | 4.99% | |
| Central Bedfordshire | £1,839.74 | 4.99% | |
| Cheshire East | £1,882.04 | 4.99% | |
| Cheshire West and Chester | £1,978.09 | 4.99% | |
| City of London | £1,059.46 | 4.99% | |
| Cornwall | £1,987.20 | 4.99% | |
| Croydon | £1,990.10 | 4.99% | |
| Cumberland | £1,907.46 | 4.99% | |
| Darlington | £1,959.11 | 4.99% | |
| Dorset | £2,101.05 | 4.99% | |
| Dudley | £1,728.88 | 4.99% | |
| Durham | £2,030.70 | 4.99% | |
| Ealing | £1,550.64 | 4.99% | |
| East Riding of Yorkshire | £1,875.38 | 4.99% | |
| Enfield | £1,673.64 | 4.99% | |
| Gateshead | £2,282.22 | 4.99% | |
| Greenwich | £1,521.43 | 4.99% | |
| Hackney | £1,476.13 | 4.99% | |
| Halton | £1,846.66 | 4.99% | |
| Hammersmith and Fulham | £961.04 | 4.99% | |
| Haringey | £1,717.56 | 4.99% | |
| Harrow | £1,905.48 | 4.99% | |
| Hartlepool | £2,083.44 | 4.99% | |
| Havering | £1,823.17 | 4.99% | |
| Herefordshire | £1,969.36 | 4.99% | |
| Hillingdon | £1,462.00 | 4.99% | |
| Hounslow | £1,595.44 | 4.99% | |
| Isle of Wight | £2,003.70 | 4.99% | |
| Isles of Scilly | £1,661.83 | 4.99% | |
| Islington | £1,521.72 | 4.99% | |
| Kingston upon Hull | £1,784.42 | 4.99% | |
| Kingston upon Thames | £1,998.96 | 4.99% | |
| Kirklees | £1,964.40 | 4.99% | |
| Knowsley | £1,932.51 | 4.99% | |
| Lambeth | £1,463.57 | 4.99% | |
| Lewisham | £1,644.75 | 4.99% | |
| Liverpool | £2,147.23 | 4.99% | |
| Luton | £1,923.62 | 4.99% | |
| Manchester | £1,783.78 | 4.99% | |
| Medway | £1,842.32 | 4.99% | |
| Merton | £1,604.05 | 4.99% | |
| Middlesbrough | £2,074.34 | 4.99% | |
| Milton Keynes | £1,759.72 | 4.99% | |
| Newcastle upon Tyne | £2,115.64 | 4.99% | |
| North Northamptonshire | £1,827.06 | 4.99% | |
| North Somerset | £1,793.75 | 4.99% | |
| North Tyneside | £2,040.50 | 4.99% | |
| Nottingham | £2,262.88 | 4.99% | |
| Oldham | £2,053.75 | 4.99% | |
| Peterborough | £1,749.42 | 4.99% | |
| Plymouth | £1,932.54 | 4.99% | |
| Portsmouth | £1,817.62 | 4.99% | |
| Reading | £2,117.52 | 4.99% | |
| Redbridge | £1,699.29 | 4.99% | |
| Redcar and Cleveland | £1,994.49 | 4.99% | |
| Richmond upon Thames | £1,881.69 | 4.99% | |
| Rochdale | £2,058.84 | 4.99% | |
| Rutland | £2,218.95 | 4.99% | |
| Salford | £2,052.77 | 4.99% | |
| Sandwell | £1,823.76 | 4.99% | |
| Sefton | £2,043.54 | 4.99% | |
| Sheffield | £2,028.99 | 4.99% | |
| Shropshire | £1,806.67 | 4.99% | |
| Slough | £1,923.09 | 4.99% | |
| Solihull | £1,755.66 | 4.99% | |
| South Gloucestershire | £1,931.33 | 4.99% | |
| Southampton | £1,903.14 | 4.99% | |
| Southend-on-Sea | £1,798.74 | 4.99% | |
| Southwark | £1,387.52 | 4.99% | |
| St Helens | £1,881.75 | 4.99% | |
| Stockport | £2,076.06 | 4.99% | |
| Stoke-on-Trent | £1,699.00 | 4.99% | |
| Sutton | £1,779.34 | 4.99% | |
| Swindon | £1,777.78 | 4.99% | |
| Tameside | £1,911.99 | 4.99% | |
| Telford and Wrekin | £1,613.67 | 4.99% | |
| Tower Hamlets | £1,264.19 | 4.99% | |
| Wakefield | £1,801.73 | 4.99% | |
| Walsall | £2,188.58 | 4.99% | |
| Waltham Forest | £1,787.27 | 4.99% | |
| West Berkshire | £1,921.41 | 4.99% | |
| West Northamptonshire | £1,866.98 | 4.99% | |
| Westmorland and Furness | £1,918.97 | 4.99% | |
| Wigan | £1,630.90 | 4.99% | |
| Wirral | £1,982.44 | 4.99% | |
| Wokingham | £1,931.04 | 4.99% | |
| Wolverhampton | £2,104.29 | 4.99% | |
| York | £1,731.05 | 4.99% | |
| Barnet | £1,545.14 | 4.98% | |
| North Yorkshire | £1,939.54 | 4.98% | |
| Warrington | £1,867.79 | 4.98% | |
| Westminster | £527.24 | 4.98% | |
| South Tyneside | £2,015.23 | 4.95% | |
| Stockton-on-Tees | £2,038.98 | 4.95% | |
| Coventry | £2,103.42 | 4.94% | |
| Barnsley | £1,878.42 | 4.90% | |
| North Lincolnshire | £1,800.36 | 4.88% | |
| Torbay | £1,946.96 | 4.75% | |
| Northumberland | £2,171.03 | 4.55% | |
| Wiltshire | £1,886.99 | 4.50% | |
| Sunderland | £1,795.98 | 4.49% | |
| Kensington and Chelsea | £1,101.21 | 4.04% | |
| Derby | £1,808.74 | 3.99% | |
| Doncaster | £1,715.55 | 3.99% | |
| North East Lincolnshire | £1,952.04 | 3.98% | |
| Rotherham | £1,870.63 | 3.00% | |
| Wandsworth | £507.37 | 2.01% |
Source: MHCLG, Council Tax levels set by local authorities in England 2025 to 2026, Table 8a, published 20 March 2025.
How much did county councils raise their share in 2025/26?
Largest first. The council's own Band D excludes parish precepts and the other bodies' shares.
| Council | Own Band D | Change | Note |
|---|---|---|---|
| Hampshire County Council | £1,609.83 | 5.00% | |
| Warwickshire County Council | £1,822.95 | 5.00% | |
| Cambridgeshire County Council | £1,700.64 | 4.99% | |
| Derbyshire County Council | £1,629.16 | 4.99% | |
| Devon County Council | £1,801.26 | 4.99% | |
| East Sussex County Council | £1,867.05 | 4.99% | |
| Gloucestershire County Council | £1,679.65 | 4.99% | |
| Hertfordshire County Council | £1,769.87 | 4.99% | |
| Kent County Council | £1,691.19 | 4.99% | |
| Lancashire County Council | £1,735.79 | 4.99% | |
| Leicestershire County Council | £1,681.50 | 4.99% | |
| Norfolk County Council | £1,755.63 | 4.99% | |
| Oxfordshire County Council | £1,911.40 | 4.99% | |
| Staffordshire County Council | £1,621.71 | 4.99% | |
| Suffolk County Council | £1,649.43 | 4.99% | |
| Surrey County Council | £1,846.35 | 4.99% | |
| West Sussex County Council | £1,800.54 | 4.99% | |
| Worcestershire County Council | £1,615.71 | 4.99% | |
| Nottinghamshire County Council | £1,894.54 | 4.84% | |
| Essex County Council | £1,579.59 | 3.75% | |
| Lincolnshire County Council | £1,625.85 | 2.99% |
Source: MHCLG, Council Tax levels set by local authorities in England 2025 to 2026, Table 8b, published 20 March 2025.
How much did district councils raise their share in 2025/26?
Largest first. The council's own Band D excludes parish precepts and the other bodies' shares.
| Council | Own Band D | Change | In pounds | Note |
|---|---|---|---|---|
| Breckland | £120.46 | 4.33% | £5.00 | |
| West Oxfordshire | £129.38 | 4.02% | £5.00 | |
| South Staffordshire | £145.34 | 3.56% | £5.00 | |
| Basingstoke and Deane | £146.42 | 3.54% | £5.00 | |
| Tewkesbury | £149.36 | 3.46% | £5.00 | |
| South Oxfordshire | £151.24 | 3.42% | £5.00 | |
| East Hampshire | £151.92 | 3.40% | £5.00 | |
| Cherwell | £158.50 | 3.26% | £5.00 | |
| Cotswold | £158.93 | 3.25% | £5.00 | |
| Hinckley and Bosworth | £159.87 | 3.23% | £5.00 | |
| Vale of White Horse | £161.69 | 3.19% | £5.00 | |
| Broxbourne | £163.24 | 3.16% | £5.00 | |
| Huntingdonshire | £165.86 | 3.11% | £5.00 | |
| Stratford-on-Avon | £169.12 | 3.05% | £5.00 | |
| Kings Lynn and West Norfolk | £169.13 | 3.04% | £4.99 | |
| East Devon | £171.78 | 3.00% | £5.00 | |
| Elmbridge | £258.14 | 3.00% | £7.51 | |
| Gravesham | £237.96 | 3.00% | £6.93 | |
| Mid Devon | £239.12 | 3.00% | £6.96 | |
| Tonbridge and Malling | £245.30 | 3.00% | £7.14 | |
| Woking | £298.11 | 3.00% | £8.68 | |
| Wyre Forest | £250.58 | 3.00% | £7.29 | |
| Adur | £343.71 | 2.99% | £9.99 | |
| Amber Valley | £197.85 | 2.99% | £5.74 | |
| Arun | £214.62 | 2.99% | £6.23 | |
| Ashford | £193.58 | 2.99% | £5.62 | |
| Babergh | £193.73 | 2.99% | £5.63 | |
| Bassetlaw | £205.90 | 2.99% | £5.98 | |
| Blaby | £194.79 | 2.99% | £5.65 | |
| Bolsover | £208.95 | 2.99% | £6.06 | |
| Boston | £261.55 | 2.99% | £7.59 | |
| Brentwood | £217.00 | 2.99% | £6.30 | |
| Bromsgrove | £257.48 | 2.99% | £7.48 | |
| Cambridge | £232.13 | 2.99% | £6.74 | |
| Cannock Chase | £251.30 | 2.99% | £7.30 | |
| Cheltenham | £244.79 | 2.99% | £7.11 | |
| Chesterfield | £196.51 | 2.99% | £5.70 | |
| Chichester | £192.06 | 2.99% | £5.58 | |
| Chorley | £215.99 | 2.99% | £6.27 | |
| Colchester | £224.44 | 2.99% | £6.52 | |
| Crawley | £239.04 | 2.99% | £6.94 | |
| Dacorum | £236.15 | 2.99% | £6.86 | |
| Derbyshire Dales | £244.07 | 2.99% | £7.09 | |
| East Suffolk | £192.15 | 2.99% | £5.58 | |
| Eastbourne | £286.04 | 2.99% | £8.30 | |
| Epping Forest | £171.99 | 2.99% | £4.99 | |
| Erewash | £220.22 | 2.99% | £6.39 | |
| Exeter | £185.76 | 2.99% | £5.39 | |
| Fareham | £191.42 | 2.99% | £5.56 | |
| Folkestone and Hythe | £304.81 | 2.99% | £8.85 | |
| Forest of Dean | £211.95 | 2.99% | £6.15 | |
| Fylde | £232.17 | 2.99% | £6.74 | |
| Gedling | £194.50 | 2.99% | £5.64 | |
| Gloucester | £237.04 | 2.99% | £6.88 | |
| Gosport | £263.01 | 2.99% | £7.64 | |
| Great Yarmouth | £192.49 | 2.99% | £5.59 | |
| Guildford | £204.09 | 2.99% | £5.93 | |
| Harborough | £183.29 | 2.99% | £5.32 | |
| Hart | £204.10 | 2.99% | £5.93 | |
| Hastings | £307.69 | 2.99% | £8.93 | |
| Hertsmere | £210.06 | 2.99% | £6.10 | |
| High Peak | £224.19 | 2.99% | £6.51 | |
| Horsham | £182.59 | 2.99% | £5.30 | |
| Hyndburn | £276.46 | 2.99% | £8.03 | |
| Lancaster | £264.30 | 2.99% | £7.67 | |
| Lewes | £234.99 | 2.99% | £6.82 | |
| Maldon | £232.01 | 2.99% | £6.74 | |
| Mansfield | £206.54 | 2.99% | £6.00 | |
| Melton | £237.76 | 2.99% | £6.91 | |
| Mole Valley | £211.28 | 2.99% | £6.13 | |
| New Forest | £205.77 | 2.99% | £5.98 | |
| North Devon | £216.68 | 2.99% | £6.29 | |
| North East Derbyshire | £216.67 | 2.99% | £6.29 | |
| North Hertfordshire | £267.78 | 2.99% | £7.77 | |
| North Warwickshire | £242.75 | 2.99% | £7.05 | |
| Norwich | £306.11 | 2.99% | £8.89 | |
| Nuneaton and Bedworth | £271.47 | 2.99% | £7.88 | |
| Oadby and Wigston | £261.64 | 2.99% | £7.60 | |
| Oxford | £356.72 | 2.99% | £10.36 | |
| Pendle | £307.52 | 2.99% | £8.93 | |
| Preston | £364.45 | 2.99% | £10.58 | |
| Redditch | £277.64 | 2.99% | £8.06 | |
| Reigate and Banstead | £264.87 | 2.99% | £7.69 | |
| Rossendale | £317.66 | 2.99% | £9.22 | |
| Rugby | £223.63 | 2.99% | £6.49 | |
| Runnymede | £196.14 | 2.99% | £5.69 | |
| Rushcliffe | £182.94 | 2.99% | £5.31 | |
| Rushmoor | £239.69 | 2.99% | £6.95 | |
| Sevenoaks | £251.01 | 2.99% | £7.29 | |
| South Cambridgeshire | £175.40 | 2.99% | £5.09 | |
| South Derbyshire | £185.24 | 2.99% | £5.38 | |
| South Ribble | £236.78 | 2.99% | £6.87 | |
| St Albans | £208.00 | 2.99% | £6.04 | |
| Stafford | £178.75 | 2.99% | £5.19 | |
| Stevenage | £246.41 | 2.99% | £7.15 | |
| Stroud | £243.08 | 2.99% | £7.06 | |
| Surrey Heath | £260.33 | 2.99% | £7.55 | |
| Tamworth | £208.76 | 2.99% | £6.06 | |
| Tandridge | £252.32 | 2.99% | £7.33 | |
| Teignbridge | £202.28 | 2.99% | £5.87 | |
| Tendring | £199.52 | 2.99% | £5.79 | |
| Test Valley | £175.60 | 2.99% | £5.09 | |
| Thanet | £271.05 | 2.99% | £7.87 | |
| Three Rivers | £206.36 | 2.99% | £5.99 | |
| Torridge | £195.17 | 2.99% | £5.67 | |
| Uttlesford | £182.02 | 2.99% | £5.28 | |
| Warwick | £187.60 | 2.99% | £5.45 | |
| Watford | £308.51 | 2.99% | £8.96 | |
| Waverley | £213.86 | 2.99% | £6.20 | |
| Wealden | £221.14 | 2.99% | £6.42 | |
| Welwyn Hatfield | £244.71 | 2.99% | £7.11 | |
| West Devon | £269.41 | 2.99% | £7.82 | |
| West Lancashire | £238.58 | 2.99% | £6.93 | |
| Worcester | £219.45 | 2.99% | £6.37 | |
| Worthing | £275.67 | 2.99% | £8.01 | |
| Wyre | £233.08 | 2.99% | £6.77 | |
| Basildon | £304.56 | 2.98% | £8.82 | |
| Canterbury | £247.05 | 2.98% | £7.16 | |
| Dover | £220.77 | 2.98% | £6.39 | |
| East Hertfordshire | £201.04 | 2.98% | £5.82 | |
| Epsom and Ewell | £232.92 | 2.98% | £6.75 | |
| Havant | £239.76 | 2.98% | £6.94 | |
| Ipswich | £419.58 | 2.98% | £12.15 | |
| Maidstone | £301.68 | 2.98% | £8.73 | |
| South Hams | £196.66 | 2.98% | £5.70 | |
| South Kesteven | £189.37 | 2.98% | £5.48 | |
| West Lindsey | £248.76 | 2.98% | £7.21 | |
| Braintree | £206.01 | 2.97% | £5.94 | |
| Castle Point | £290.16 | 2.97% | £8.37 | |
| Charnwood | £173.10 | 2.97% | £5.00 | |
| East Lindsey | £171.54 | 2.97% | £4.95 | |
| Winchester | £188.51 | 2.97% | £5.43 | |
| Chelmsford | £228.07 | 2.96% | £6.55 | |
| South Holland | £215.76 | 2.96% | £6.20 | |
| Staffordshire Moorlands | £185.96 | 2.96% | £5.35 | |
| Swale | £206.64 | 2.96% | £5.94 | |
| West Suffolk | £203.67 | 2.96% | £5.85 | |
| Mid Sussex | £196.43 | 2.95% | £5.63 | |
| Rochford | £267.66 | 2.95% | £7.66 | |
| North Norfolk | £173.52 | 2.94% | £4.95 | |
| South Norfolk | £175.14 | 2.94% | £5.00 | |
| Tunbridge Wells | £211.20 | 2.94% | £6.03 | |
| Broxtowe | £193.66 | 2.93% | £5.51 | |
| Lincoln | £316.98 | 2.92% | £9.00 | |
| East Staffordshire | £215.73 | 2.90% | £6.09 | |
| Spelthorne | £228.86 | 2.90% | £6.45 | |
| Rother | £231.10 | 2.89% | £6.49 | |
| North West Leicestershire | £184.03 | 2.79% | £4.99 | |
| North Kesteven | £200.05 | 2.76% | £5.37 | |
| Lichfield | £197.85 | 2.59% | £5.00 | |
| Wychavon | £128.21 | 2.50% | £3.13 | |
| Burnley | £344.58 | 2.00% | £6.76 | |
| Dartford | £188.64 | 2.00% | £3.69 | |
| Newcastle-under-Lyme | £223.04 | 1.99% | £4.35 | |
| Newark and Sherwood | £198.60 | 1.94% | £3.78 | |
| Eastleigh | £143.78 | 1.50% | £2.12 | |
| Ashfield | £207.13 | 0.00% | £0.00 | |
| East Cambridgeshire | £142.14 | 0.00% | £0.00 | |
| Fenland | £254.79 | 0.00% | £0.00 | |
| Harlow | £288.90 | 0.00% | £0.00 | |
| Malvern Hills | £182.60 | 0.00% | £0.00 | |
| Mid Suffolk | £175.03 | 0.00% | £0.00 | |
| Ribble Valley | £170.69 | 0.00% | £0.00 | |
| Broadland | £136.16 | -0.56% | -£0.77 |
Source: MHCLG, Council Tax levels set by local authorities in England 2025 to 2026, Table 8c, published 20 March 2025.
How much did council tax go up in 2024/25?
How much could a council raise council tax without a referendum in 2024/25?
A council that sets an increase in its own share above the limit for the year must hold a local referendum. The principles for 2024/25, as MHCLG's technical notes set them out, are quoted below. Rows for councils with a different limit carry MHCLG's note saying so.
Authorities are required to hold a referendum if their relevant basic amount of council tax for 2024-25 is in excess of the council tax referendum principles which apply to them. The referendum principles are: 5% or more than 5% (comprising up to a maximum of 2% for expenditure on adult social care and 3% on other expenditure) for authorities with responsibility for adult social care services. 5% or more than 5% (comprising up to a maximum of 2% for expenditure on adult social care and 3% on other expenditure) for unitarising authorities with responsibility for adult social care services which are equalising difference council tax levels across their predecessor areas. The principle may be applied to either the increase in each individual predecessor area, or to the tax base-weighted average band D figure of all the predecessor areas. More than £5, or 3% or more than 3%, (the greater of the two) for district councils in 2 tier areas. More than £13 for Police and Crime Commissioners. More than £13 for the police component of the Greater Manchester Combined Authority and the West Yorkshire Combined Authority precept. 3% or more than 3%, for fire and rescue authorities. More than £37.26 for the adjusted relevant basic amount of council tax of the GLA. More than £24.26 for the unadjusted relevant basic amount of council tax of the GLA. 10% or more than 10% for Woking Borough Council. 10% or more than 10% [comprising of up to a maximum of 2% expenditure on adult social care and 8% on other expenditure] for Birmingham City Council, Slough Council and Thurrock Council. No referendum principles were set for mayoral combined authorities or local precepting authorities.
Source: MHCLG, Council Tax levels set by local authorities in England 2024 to 2025: technical notes (revised), section 5.27, published 21 March 2024.
How much did London boroughs, metropolitan districts and unitary authorities raise their share in 2024/25?
Largest first. The council's own Band D excludes parish precepts and the other bodies' shares.
| Council | Own Band D | Change | Note |
|---|---|---|---|
| Birmingham | £1,793.01 | 9.99% | |
| Slough UA | £1,831.69 | 8.50% | |
| Thurrock UA | £1,711.62 | 7.98% | |
| Dorset Council UA | £2,001.15 | 5.00% | |
| Leicester UA | £1,924.63 | 5.00% | |
| Merton | £1,527.88 | 5.00% | |
| Barking & Dagenham | £1,531.35 | 4.99% | |
| Barnsley | £1,790.68 | 4.99% | |
| Bath & North East Somerset UA | £1,736.42 | 4.99% | |
| Bedford UA | £1,824.64 | 4.99% | |
| Bexley | £1,683.64 | 4.99% | |
| Blackburn with Darwen UA | £1,871.52 | 4.99% | |
| Blackpool UA | £1,928.87 | 4.99% | |
| Bolton | £1,771.84 | 4.99% | |
| Bournemouth, Christchurch & Poole UA | £1,767.22 | 4.99% | |
| Bracknell Forest UA | £1,616.13 | 4.99% | |
| Bradford | £1,701.86 | 4.99% | |
| Brent | £1,564.65 | 4.99% | |
| Brighton & Hove UA | £1,978.02 | 4.99% | |
| Bristol UA | £2,095.69 | 4.99% | |
| Bromley | £1,478.31 | 4.99% | |
| Bury | £1,919.55 | 4.99% | |
| Calderdale | £1,845.44 | 4.99% | |
| Camden | £1,539.47 | 4.99% | |
| Central Bedfordshire UA | £1,752.30 | 4.99% | |
| Cheshire East UA | £1,792.59 | 4.99% | |
| Cheshire West and Chester UA | £1,884.07 | 4.99% | |
| City of London | £1,009.11 | 4.99% | |
| Cornwall UA | £1,892.75 | 4.99% | |
| Croydon | £1,895.51 | 4.99% | |
| Cumberland | £1,816.80 | 4.99% | The year on year percentage change is based on a comparison with an agreed alternative notional amount, rather than the actual Band D set. |
| Darlington UA | £1,866.02 | 4.99% | |
| Derby UA | £1,739.34 | 4.99% | |
| Doncaster | £1,649.73 | 4.99% | |
| Dudley | £1,646.71 | 4.99% | |
| Durham UA | £1,934.18 | 4.99% | |
| Ealing | £1,476.94 | 4.99% | |
| East Riding of Yorkshire UA | £1,786.29 | 4.99% | |
| Enfield | £1,594.08 | 4.99% | |
| Gateshead | £2,173.77 | 4.99% | |
| Greenwich | £1,449.13 | 4.99% | |
| Hackney | £1,405.97 | 4.99% | |
| Halton UA | £1,758.89 | 4.99% | |
| Hammersmith & Fulham | £915.37 | 4.99% | |
| Haringey | £1,635.92 | 4.99% | |
| Harrow | £1,814.92 | 4.99% | |
| Havering | £1,736.52 | 4.99% | |
| Herefordshire UA | £1,875.76 | 4.99% | |
| Hillingdon | £1,392.51 | 4.99% | |
| Hounslow | £1,519.61 | 4.99% | |
| Isle of Wight Council UA | £1,908.39 | 4.99% | |
| Isles of Scilly | £1,582.85 | 4.99% | |
| Islington | £1,449.41 | 4.99% | |
| Kensington & Chelsea | £1,058.45 | 4.99% | |
| Kingston-upon-Hull UA | £1,699.61 | 4.99% | |
| Kingston-upon-Thames | £1,903.95 | 4.99% | |
| Kirklees | £1,871.04 | 4.99% | |
| Knowsley | £1,840.66 | 4.99% | |
| Lambeth | £1,394.01 | 4.99% | |
| Lewisham | £1,566.58 | 4.99% | |
| Liverpool | £2,045.17 | 4.99% | |
| Luton UA | £1,832.19 | 4.99% | |
| Manchester | £1,699.00 | 4.99% | |
| Medway UA | £1,754.69 | 4.99% | |
| Middlesbrough UA | £1,975.76 | 4.99% | |
| Milton Keynes UA | £1,676.08 | 4.99% | |
| Newcastle-upon-Tyne | £2,015.10 | 4.99% | |
| Newham | £1,252.94 | 4.99% | |
| North Northamptonshire | £1,740.22 | 4.99% | |
| North Tyneside | £1,943.52 | 4.99% | |
| North Yorkshire | £1,847.62 | 4.99% | The year on year percentage change is based on a comparison with an agreed alternative notional amount, rather than the actual Band D set. |
| Nottingham UA | £2,155.33 | 4.99% | |
| Oldham | £1,956.13 | 4.99% | |
| Peterborough UA | £1,666.27 | 4.99% | |
| Plymouth UA | £1,840.69 | 4.99% | |
| Portsmouth UA | £1,731.15 | 4.99% | |
| Reading UA | £2,016.88 | 4.99% | |
| Redbridge | £1,618.47 | 4.99% | |
| Redcar & Cleveland UA | £1,899.72 | 4.99% | |
| Richmond-upon-Thames | £1,792.26 | 4.99% | |
| Rochdale | £1,960.99 | 4.99% | |
| Rutland UA | £2,113.49 | 4.99% | |
| Salford | £1,955.21 | 4.99% | |
| Sandwell | £1,737.08 | 4.99% | |
| Sefton | £1,946.41 | 4.99% | |
| Sheffield | £1,932.56 | 4.99% | |
| Shropshire UA | £1,720.80 | 4.99% | |
| Solihull | £1,672.22 | 4.99% | |
| Somerset | £1,729.29 | 4.99% | |
| South Gloucestershire UA | £1,839.54 | 4.99% | |
| Southampton UA | £1,812.69 | 4.99% | |
| Southend-on-Sea UA | £1,713.24 | 4.99% | |
| Southwark | £1,321.58 | 4.99% | |
| St Helens | £1,792.31 | 4.99% | |
| Stockport | £1,977.39 | 4.99% | |
| Stoke-on-Trent UA | £1,618.25 | 4.99% | |
| Sunderland | £1,718.81 | 4.99% | |
| Sutton | £1,694.78 | 4.99% | |
| Swindon UA | £1,693.28 | 4.99% | |
| Tameside | £1,821.12 | 4.99% | |
| Telford & Wrekin UA | £1,536.98 | 4.99% | |
| Tower Hamlets | £1,204.11 | 4.99% | |
| Trafford | £1,601.63 | 4.99% | |
| Wakefield | £1,716.09 | 4.99% | |
| Walsall | £2,084.55 | 4.99% | |
| Waltham Forest | £1,702.32 | 4.99% | |
| West Berkshire UA | £1,830.09 | 4.99% | |
| West Northamptonshire | £1,778.25 | 4.99% | |
| Westmorland and Furness | £1,827.76 | 4.99% | |
| Wigan | £1,553.39 | 4.99% | |
| Wiltshire UA | £1,805.73 | 4.99% | |
| Wirral | £1,888.22 | 4.99% | |
| Wokingham UA | £1,839.26 | 4.99% | |
| Wolverhampton | £2,004.27 | 4.99% | |
| York UA | £1,648.78 | 4.99% | |
| Barnet | £1,471.84 | 4.98% | |
| Buckinghamshire UA | £1,848.41 | 4.98% | |
| Leeds | £1,726.84 | 4.98% | |
| North East Lincolnshire UA | £1,877.32 | 4.98% | |
| North Somerset UA | £1,708.50 | 4.98% | |
| Warrington UA | £1,779.19 | 4.98% | |
| Westminster | £502.21 | 4.98% | |
| Windsor & Maidenhead UA | £1,303.19 | 4.96% | |
| South Tyneside | £1,920.18 | 4.95% | |
| Stockton-on-Tees UA | £1,942.81 | 4.95% | |
| Coventry | £2,004.31 | 4.94% | |
| Torbay UA | £1,858.67 | 4.75% | |
| Northumberland UA | £2,076.50 | 4.59% | |
| North Lincolnshire UA | £1,716.65 | 3.73% | |
| Rotherham | £1,816.15 | 3.50% | |
| Hartlepool UA | £1,984.42 | 2.99% | |
| Wandsworth | £497.36 | 2.09% |
Source: MHCLG, Council Tax levels set by local authorities in England 2024 to 2025, Table 7a, published 21 March 2024.
How much did county councils raise their share in 2024/25?
Largest first. The council's own Band D excludes parish precepts and the other bodies' shares.
| Council | Own Band D | Change | Note |
|---|---|---|---|
| Hampshire County Council | £1,533.24 | 5.00% | |
| Warwickshire County Council | £1,736.19 | 5.00% | |
| Cambridgeshire County Council | £1,619.82 | 4.99% | |
| Derbyshire County Council | £1,551.73 | 4.99% | |
| Devon County Council | £1,715.67 | 4.99% | |
| East Sussex County Council | £1,778.31 | 4.99% | |
| Essex County Council | £1,522.53 | 4.99% | |
| Gloucestershire County Council | £1,599.82 | 4.99% | |
| Hertfordshire County Council | £1,685.75 | 4.99% | |
| Kent County Council | £1,610.82 | 4.99% | |
| Lancashire County Council | £1,653.29 | 4.99% | |
| Leicestershire County Council | £1,601.58 | 4.99% | |
| Lincolnshire County Council | £1,578.69 | 4.99% | |
| Norfolk County Council | £1,672.11 | 4.99% | |
| Oxfordshire County Council | £1,820.56 | 4.99% | |
| Staffordshire County Council | £1,544.64 | 4.99% | |
| Suffolk County Council | £1,571.04 | 4.99% | |
| Surrey County Council | £1,758.60 | 4.99% | |
| West Sussex County Council | £1,714.95 | 4.99% | |
| Worcestershire County Council | £1,538.92 | 4.99% | |
| Nottinghamshire County Council | £1,807.08 | 4.84% |
Source: MHCLG, Council Tax levels set by local authorities in England 2024 to 2025, Table 7b, published 21 March 2024.
How much did district councils raise their share in 2024/25?
Largest first. The council's own Band D excludes parish precepts and the other bodies' shares.
| Council | Own Band D | Change | In pounds | Note |
|---|---|---|---|---|
| Woking | £289.43 | 10.00% | £26.31 | |
| Breckland | £115.46 | 4.53% | £5.00 | |
| West Oxfordshire | £124.38 | 4.19% | £5.00 | |
| South Staffordshire | £140.34 | 3.69% | £5.00 | |
| Basingstoke & Deane | £141.42 | 3.67% | £5.00 | |
| Eastleigh | £141.66 | 3.66% | £5.00 | |
| Tewkesbury | £144.36 | 3.59% | £5.00 | |
| South Oxfordshire | £146.24 | 3.54% | £5.00 | |
| East Hampshire | £146.92 | 3.52% | £5.00 | |
| Broadland | £136.93 | 3.39% | £4.49 | |
| Cherwell | £153.50 | 3.37% | £5.00 | |
| Cotswold | £153.93 | 3.36% | £5.00 | |
| Hinckley & Bosworth | £154.87 | 3.34% | £5.00 | |
| Vale of White Horse | £156.69 | 3.30% | £5.00 | |
| Broxbourne | £158.24 | 3.26% | £5.00 | |
| Huntingdonshire | £160.86 | 3.21% | £5.00 | |
| King's Lynn & West Norfolk | £164.14 | 3.14% | £4.99 | |
| Stratford-on-Avon | £164.12 | 3.14% | £5.00 | |
| East Devon | £166.78 | 3.09% | £5.00 | |
| East Lindsey | £166.59 | 3.06% | £4.95 | |
| North Norfolk | £168.57 | 3.03% | £4.95 | |
| South Norfolk | £170.14 | 3.03% | £5.00 | |
| Ribble Valley | £170.69 | 3.02% | £5.00 | |
| South Cambridgeshire | £170.31 | 3.02% | £5.00 | |
| Test Valley | £170.51 | 3.01% | £4.99 | |
| Adur | £333.72 | 3.00% | £9.72 | |
| Boston | £253.96 | 3.00% | £7.40 | |
| Colchester | £217.92 | 3.00% | £6.34 | |
| Crawley | £232.10 | 3.00% | £6.76 | |
| Mid Devon | £232.16 | 3.00% | £6.76 | |
| Tonbridge & Malling | £238.16 | 3.00% | £6.93 | |
| West Suffolk | £197.82 | 3.00% | £5.76 | |
| Wyre Forest | £243.29 | 3.00% | £7.08 | |
| Amber Valley | £192.11 | 2.99% | £5.58 | |
| Arun | £208.39 | 2.99% | £6.05 | |
| Ashford | £187.96 | 2.99% | £5.46 | |
| Babergh | £188.10 | 2.99% | £5.46 | |
| Bassetlaw | £199.92 | 2.99% | £5.80 | |
| Blaby | £189.14 | 2.99% | £5.49 | |
| Bolsover | £202.89 | 2.99% | £5.89 | |
| Brentwood | £210.70 | 2.99% | £6.12 | |
| Bromsgrove | £250.00 | 2.99% | £7.26 | |
| Burnley | £337.82 | 2.99% | £9.81 | |
| Cambridge | £225.39 | 2.99% | £6.54 | |
| Cannock Chase | £244.00 | 2.99% | £7.08 | |
| Canterbury | £239.89 | 2.99% | £6.97 | |
| Chelmsford | £221.52 | 2.99% | £6.44 | |
| Cheltenham | £237.68 | 2.99% | £6.90 | |
| Chesterfield | £190.81 | 2.99% | £5.54 | |
| Chichester | £186.48 | 2.99% | £5.41 | |
| Chorley | £209.72 | 2.99% | £6.09 | |
| Dacorum | £229.29 | 2.99% | £6.66 | |
| Derbyshire Dales | £236.98 | 2.99% | £6.88 | |
| Eastbourne | £277.74 | 2.99% | £8.06 | |
| Elmbridge | £250.63 | 2.99% | £7.28 | |
| Epping Forest | £167.00 | 2.99% | £4.85 | |
| Epsom & Ewell | £226.17 | 2.99% | £6.57 | |
| Erewash | £213.83 | 2.99% | £6.21 | |
| Exeter | £180.37 | 2.99% | £5.24 | |
| Fareham | £185.86 | 2.99% | £5.40 | |
| Folkestone & Hythe | £295.96 | 2.99% | £8.59 | |
| Forest of Dean | £205.80 | 2.99% | £5.97 | |
| Fylde | £225.43 | 2.99% | £6.54 | |
| Gedling | £188.86 | 2.99% | £5.48 | |
| Gloucester | £230.16 | 2.99% | £6.68 | |
| Gosport | £255.37 | 2.99% | £7.42 | |
| Great Yarmouth | £186.90 | 2.99% | £5.42 | |
| Guildford | £198.16 | 2.99% | £5.75 | |
| Hart | £198.17 | 2.99% | £5.75 | |
| Hastings | £298.76 | 2.99% | £8.67 | |
| Havant | £232.82 | 2.99% | £6.76 | |
| Hertsmere | £203.96 | 2.99% | £5.92 | |
| High Peak | £217.68 | 2.99% | £6.32 | |
| Horsham | £177.29 | 2.99% | £5.15 | |
| Hyndburn | £268.43 | 2.99% | £7.79 | |
| Lancaster | £256.63 | 2.99% | £7.45 | |
| Lewes | £228.17 | 2.99% | £6.62 | |
| Mansfield | £200.54 | 2.99% | £5.82 | |
| Melton | £230.85 | 2.99% | £6.71 | |
| Mole Valley | £205.15 | 2.99% | £5.96 | |
| New Forest | £199.79 | 2.99% | £5.80 | |
| Newark & Sherwood | £194.82 | 2.99% | £5.66 | |
| North Devon | £210.39 | 2.99% | £6.11 | |
| North East Derbyshire | £210.38 | 2.99% | £6.11 | |
| North Hertfordshire | £260.01 | 2.99% | £7.55 | |
| North Warwickshire | £235.70 | 2.99% | £6.84 | |
| Norwich | £297.22 | 2.99% | £8.63 | |
| Nuneaton & Bedworth | £263.59 | 2.99% | £7.65 | |
| Oadby & Wigston | £254.04 | 2.99% | £7.38 | |
| Oxford | £346.36 | 2.99% | £10.06 | |
| Pendle | £298.59 | 2.99% | £8.67 | |
| Preston | £353.87 | 2.99% | £10.27 | |
| Redditch | £269.58 | 2.99% | £7.83 | |
| Reigate & Banstead | £257.18 | 2.99% | £7.47 | |
| Rochford | £260.00 | 2.99% | £7.55 | |
| Rossendale | £308.44 | 2.99% | £8.95 | |
| Rother | £224.61 | 2.99% | £6.52 | |
| Rugby | £217.14 | 2.99% | £6.30 | |
| Runnymede | £190.45 | 2.99% | £5.53 | |
| Rushmoor | £232.74 | 2.99% | £6.76 | |
| South Derbyshire | £179.86 | 2.99% | £5.22 | |
| South Hams | £190.96 | 2.99% | £5.54 | |
| South Holland | £209.56 | 2.99% | £6.09 | |
| South Ribble | £229.91 | 2.99% | £6.67 | |
| St Albans | £201.96 | 2.99% | £5.86 | |
| Stafford | £173.56 | 2.99% | £5.04 | |
| Stevenage | £239.26 | 2.99% | £6.95 | |
| Stroud | £236.02 | 2.99% | £6.85 | |
| Surrey Heath | £252.78 | 2.99% | £7.34 | |
| Tandridge | £244.99 | 2.99% | £7.11 | |
| Teignbridge | £196.41 | 2.99% | £5.70 | |
| Tendring | £193.73 | 2.99% | £5.62 | |
| Thanet | £263.18 | 2.99% | £7.64 | |
| Three Rivers | £200.37 | 2.99% | £5.82 | |
| Torridge | £189.50 | 2.99% | £5.50 | |
| Uttlesford | £176.74 | 2.99% | £5.13 | |
| Warwick | £182.15 | 2.99% | £5.29 | |
| Watford | £299.55 | 2.99% | £8.70 | |
| Waverley | £207.66 | 2.99% | £6.02 | |
| Wealden | £214.72 | 2.99% | £6.23 | |
| West Devon | £261.59 | 2.99% | £7.59 | |
| West Lancashire | £231.65 | 2.99% | £6.73 | |
| West Lindsey | £241.55 | 2.99% | £7.01 | |
| Worcester | £213.08 | 2.99% | £6.19 | |
| Wyre | £226.31 | 2.99% | £6.57 | |
| Basildon | £295.74 | 2.98% | £8.55 | |
| Dover | £214.38 | 2.98% | £6.21 | |
| East Suffolk | £186.57 | 2.98% | £5.40 | |
| Ipswich | £407.43 | 2.98% | £11.79 | |
| Maldon | £225.27 | 2.98% | £6.52 | |
| Worthing | £267.66 | 2.98% | £7.74 | |
| East Hertfordshire | £195.22 | 2.97% | £5.63 | |
| Maidstone | £292.95 | 2.97% | £8.46 | |
| Sevenoaks | £243.72 | 2.97% | £7.02 | |
| South Kesteven | £183.89 | 2.97% | £5.31 | |
| Braintree | £200.07 | 2.96% | £5.76 | |
| Mid Sussex | £190.80 | 2.96% | £5.49 | |
| Welwyn Hatfield | £237.60 | 2.96% | £6.84 | |
| Staffordshire Moorlands | £180.61 | 2.95% | £5.18 | |
| Swale | £200.70 | 2.95% | £5.76 | |
| Tamworth | £202.70 | 2.95% | £5.81 | |
| Winchester | £183.08 | 2.95% | £5.24 | |
| Ashfield | £207.13 | 2.94% | £5.92 | |
| Broxtowe | £188.15 | 2.93% | £5.36 | |
| Gravesham | £231.03 | 2.93% | £6.57 | |
| Lincoln | £307.98 | 2.92% | £8.73 | |
| Rushcliffe | £177.63 | 2.90% | £5.00 | |
| Spelthorne | £222.41 | 2.90% | £6.27 | |
| Wychavon | £125.08 | 2.87% | £3.49 | |
| Tunbridge Wells | £205.17 | 2.86% | £5.71 | |
| Malvern Hills | £182.60 | 2.82% | £5.00 | |
| Charnwood | £168.10 | 2.77% | £4.53 | |
| East Staffordshire | £209.64 | 2.77% | £5.66 | |
| North Kesteven | £189.45 | 2.68% | £4.95 | |
| Lichfield | £192.85 | 2.66% | £5.00 | |
| North West Leicestershire | £179.04 | 2.50% | £4.36 | |
| Mid Suffolk | £175.03 | 2.00% | £3.44 | |
| Dartford | £184.95 | 1.99% | £3.60 | |
| Newcastle-under-Lyme | £218.69 | 1.99% | £4.27 | |
| Castle Point | £281.79 | 0.00% | £0.00 | |
| East Cambridgeshire | £142.14 | 0.00% | £0.00 | |
| Harborough | £177.97 | 0.00% | £0.00 | |
| Harlow | £288.90 | 0.00% | £0.00 | |
| Fenland | £254.79 | -0.18% | -£0.45 |
Source: MHCLG, Council Tax levels set by local authorities in England 2024 to 2025, Table 7c, published 21 March 2024.