Council
Birmingham council tax bands and charges 2026/27
A metropolitan district in West Midlands.
Band D, 2026/27, area average
£2,362.90
up £117.49 (5.2%) on 2025/26
Includes average parish precepts, before discounts.
Calculation
The change is the 2026/27 Band D charge less the 2025/26 charge of £2,245.41, and that difference as a percentage of the 2025/26 charge, rounded to one decimal place.
Calculated from two published tables: MHCLG Council tax levels 2026/27, Table 9, and 2025/26, Table 9. Full reference
Birmingham council's own Band D, 2026/27
£2,023.48
up 4.99% on 2025/26, as published
The council's own share of the bill.
Area Band D within metropolitan districts
13th of 36
Counted from the lowest.
Calculation
Every one of the 36 metropolitan districts in England put in order of its published area Band D for 2026/27, from the lowest. Equal figures share a position.
Positions calculated from the published figures: MHCLG Council tax levels 2026/27, Table 9 and Table 8a. Full reference
Properties in Band D or below
91.6%
Of the properties on the valuation list in Birmingham.
Calculation
HMRC's printed counts for Bands A to D added together, divided by its printed total of all properties, to one decimal place. HMRC rounds every count to the nearest 10.
Share calculated from the printed counts: HM Revenue & Customs Council Tax stock of properties, table CTSOP1.1. Full reference
2027/28 charges: not yet published in the source editions held here.
How much is council tax in Birmingham in 2026/27?
Published yearly charge for each band, before discounts.
The figures as a table
| Bands A to H in Birmingham, 2026/27 | |
|---|---|
| A | £1,575.27 |
| B | £1,837.81 |
| C | £2,100.36 |
| D | £2,362.90 |
| E | £2,887.99 |
| F | £3,413.08 |
| G | £3,938.17 |
| H | £4,725.80 |
| Source: MHCLG, Council Tax levels set by local authorities in England 2026 to 2027, Table 9, 25 March 2026. | |
Source: MHCLG, Council Tax levels set by local authorities in England 2026 to 2027, Table 9, 25 March 2026.
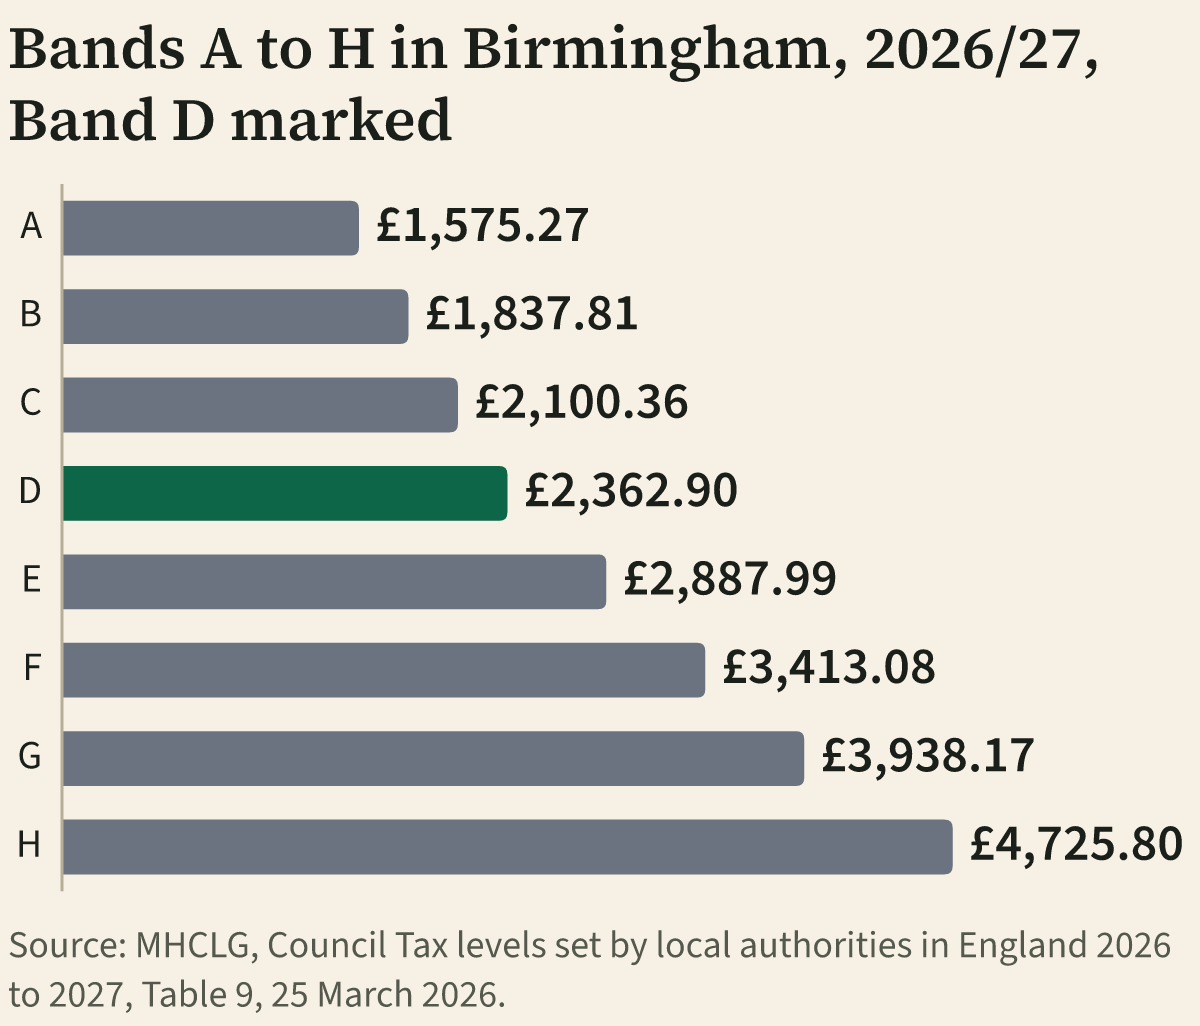
Band table, with each charge divided by 10 and by 12
| Band | Yearly charge | Divided by 10 | Divided by 12 |
|---|---|---|---|
| A | £1,575.27 | £157.53 | £131.27 |
| B | £1,837.81 | £183.78 | £153.15 |
| C | £2,100.36 | £210.04 | £175.03 |
| D | £2,362.90 | £236.29 | £196.91 |
| E | £2,887.99 | £288.80 | £240.67 |
| F | £3,413.08 | £341.31 | £284.42 |
| G | £3,938.17 | £393.82 | £328.18 |
| H | £4,725.80 | £472.58 | £393.82 |
The two right hand columns are our calculation: the published yearly charge divided by 10 and by 12, rounded to the penny. They are not your instalments. GOV.UK says “The cost is usually split into 10 monthly payments”, and your council can agree 12. Your bill sets the actual amounts and dates.
Divided by 10 and by 12 calculated from it: MHCLG Council tax levels 2026/27, Table 9. Full reference
Instalment wording: GOV.UK, How Council Tax works, Paying your bill, updated 5 February 2025, read 9 November 2026.
Change on 2025/26 by band
Choose a band to see its change on 2025/26. The band you choose is also set in the compare link above.
Calculated from two published tables: MHCLG Council tax levels 2026/27, Table 9, and 2025/26, Table 9. Full reference
Calculated from two published tables: MHCLG Council tax levels 2026/27, Table 9, and 2025/26, Table 9. Full reference
Calculated from two published tables: MHCLG Council tax levels 2026/27, Table 9, and 2025/26, Table 9. Full reference
Calculated from two published tables: MHCLG Council tax levels 2026/27, Table 9, and 2025/26, Table 9. Full reference
Calculated from two published tables: MHCLG Council tax levels 2026/27, Table 9, and 2025/26, Table 9. Full reference
Calculated from two published tables: MHCLG Council tax levels 2026/27, Table 9, and 2025/26, Table 9. Full reference
Calculated from two published tables: MHCLG Council tax levels 2026/27, Table 9, and 2025/26, Table 9. Full reference
Calculated from two published tables: MHCLG Council tax levels 2026/27, Table 9, and 2025/26, Table 9. Full reference
Every band includes the share of every body that sets council tax in Birmingham, with parish and town council precepts as an average across the area. A home in a parish pays that parish's own precept instead of the average, so its bill differs. Discounts, such as the single person discount, are not taken off.
Who receives your council tax
Band D bill breakdown in Birmingham
These are the published 2026/27 area averages. Parish charges are averaged into the council line. They are already included in the total and must not be added again.
The figures as a table
| Charge | Share of the bill | |
|---|---|---|
| Birmingham council | £2,033.21 | 86.0% |
| Police | £244.50 | 10.3% |
| Fire | £85.19 | 3.6% |
| Published area average | £2,362.90 | 100% |
| Source: MHCLG, Council tax levels set by local authorities in England 2026 to 2027: Table 10, Data_Billing, retrieved 5 October 2026. | ||
Source: MHCLG, Council tax levels set by local authorities in England 2026 to 2027: Table 10, Data_Billing, retrieved 5 October 2026.
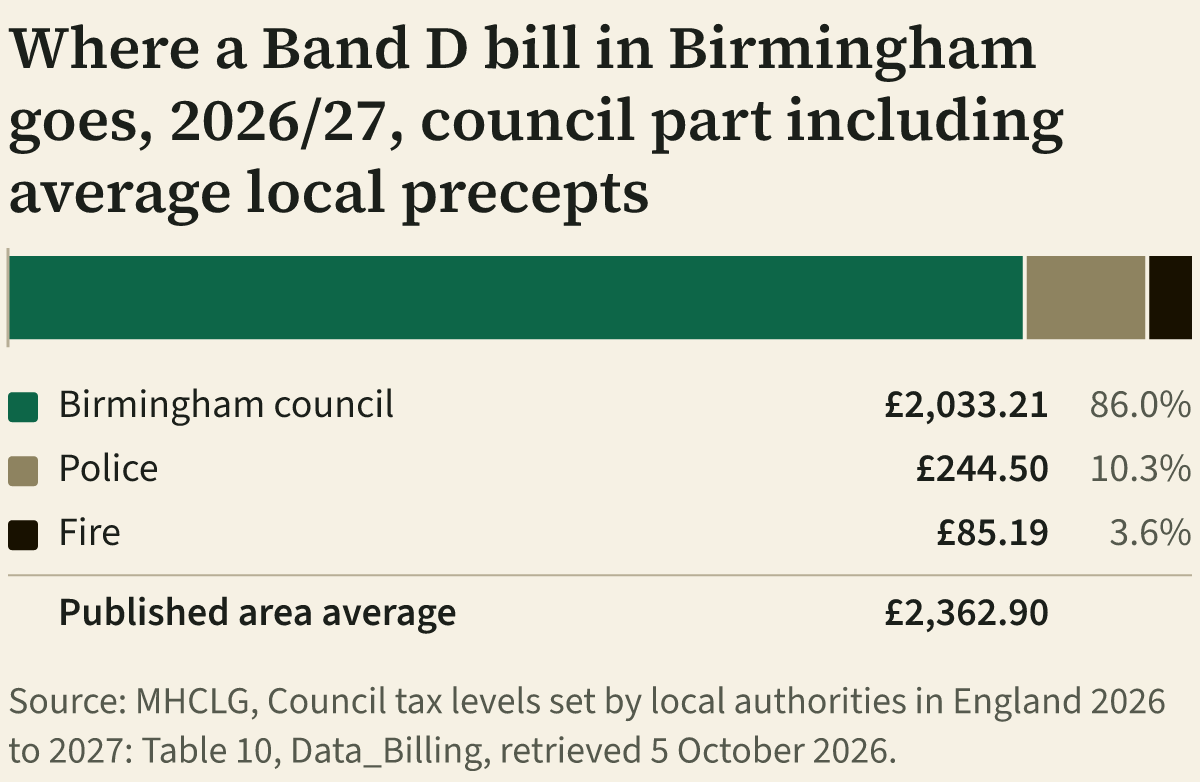
Each share is rounded to one decimal place, so together they add to 99.9%.
| Part of the bill | Charging body | Annual Band D |
|---|---|---|
| Council, including average local precepts | Birmingham | £2,033.21 |
| Police | West Midlands PCC | £244.50 |
| Fire | West Midlands Fire | £85.19 |
| Combined authority | West Midlands Combined Authority | £0.00 |
| Published area average, including all precepts | £2,362.90 | |
Adult social care is included in council charges. Police and fire may be funded within another line, including a combined-authority or GLA charge. A zero separate line does not mean the service is absent. The named bodies come from MHCLG's billing-area mapping for this year.
The council's own Band D, excluding local precepts, is £2,023.48. This is a separate measure, not an additional charge.
Source: Council tax levels set by local authorities in England 2026 to 2027: Table 10, Data_Billing and Precepting_Bodies. Retrieved 2026-10-05. Download data and checksums.
How does Band D in Birmingham compare?
Within metropolitan districts in 2026/27: Birmingham is 13th of 36 for area Band D and 17th of 36 for the council's own Band D, counted from the lowest.
All metropolitan districts ranked by Band D.
Positions calculated from the published figures: MHCLG Council tax levels 2026/27, Table 9 and Table 8a. Full reference
The figures as a table
| Area Band D within metropolitan districts, 2026/27 | How | |
|---|---|---|
| Birmingham | £2,362.90 | Published |
| Lowest of the 36 | £2,144.84 | Published |
| Median | £2,437.75 | Calculated from the 36 published values |
| 90th percentile | £2,610.57 | Calculated from the 36 published values |
| Highest of the 36 | £2,715.81 | Published |
| Median and 90th percentile calculated from the published values of the 36 metropolitan districts, by linear interpolation. Basis: Area Band D, including adult social care and average parish precepts, MHCLG Table 9. Source: MHCLG, Council Tax levels set by local authorities in England 2026 to 2027, Table 9, 25 March 2026. | ||
Source: MHCLG, Council Tax levels set by local authorities in England 2026 to 2027, Table 9, 25 March 2026.
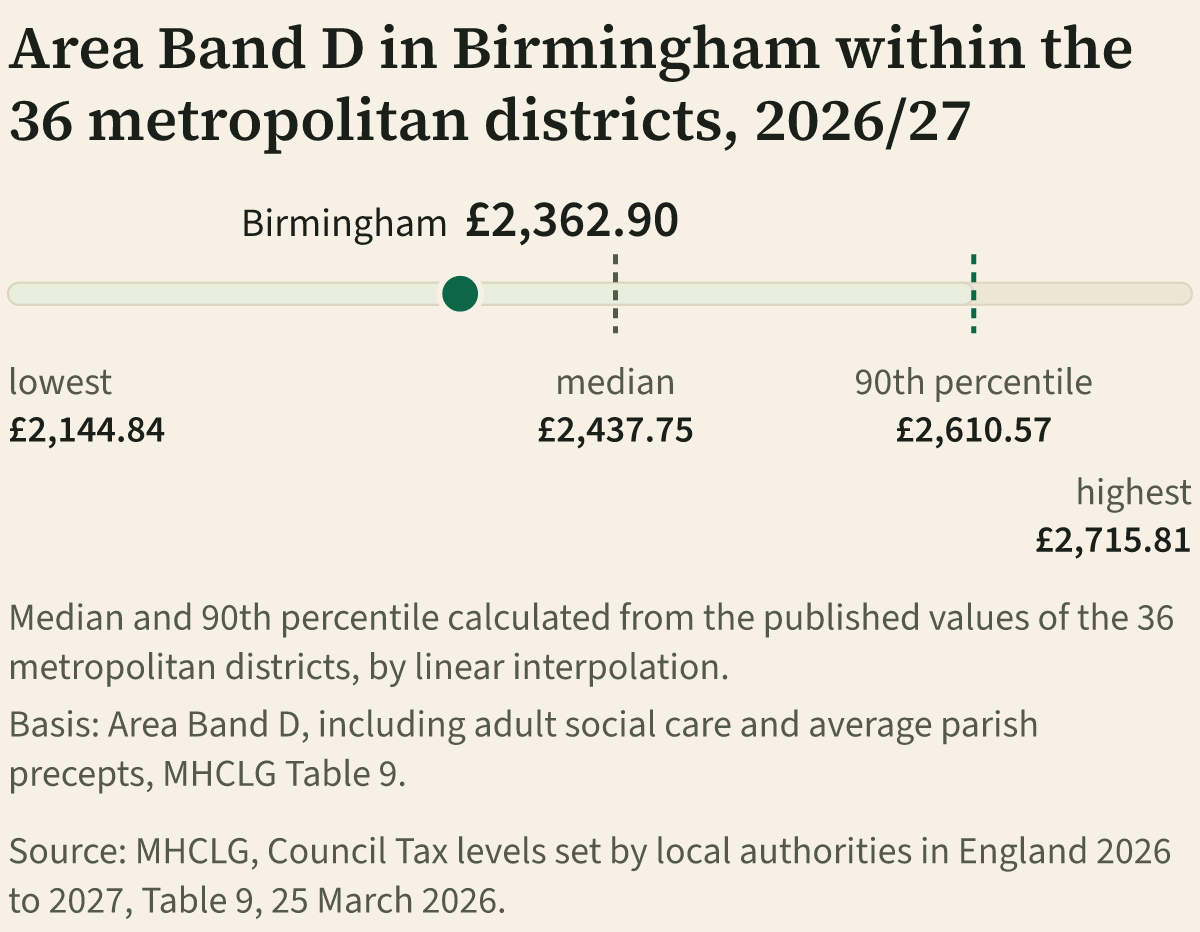
Both averages include parish and adult social care precepts, the same basis as the Birmingham figure.Band D in West Midlands, starting with metropolitan districts.
Where Birmingham is
The figures as a table
| Area | Birmingham |
|---|---|
| Walsall | £2,627.48 |
| Wolverhampton | £2,538.99 |
| North Warwickshire | £2,532.10 |
| Stratford-on-Avon | £2,484.17 |
| Bromsgrove | £2,478.65 |
| Warwick | £2,461.55 |
| Cannock Chase | £2,375.83 |
| Wychavon | £2,373.19 |
| Birmingham (this place) | £2,362.90 |
| Lichfield | £2,351.90 |
| South Staffordshire | £2,313.67 |
| Tamworth | £2,300.76 |
| Sandwell | £2,244.46 |
| Solihull | £2,197.26 |
| Dudley | £2,144.84 |
| Source: MHCLG, Council Tax levels set by local authorities in England 2026 to 2027, Table 9, 25 March 2026. Contains OS data © Crown copyright and database right 2026. Contains National Statistics data © Crown copyright and database right 2026. Licensed under OGL v3.0 | |
Source: MHCLG, Council Tax levels set by local authorities in England 2026 to 2027, Table 9, 25 March 2026.
Shaded by area Band D, the average bill for each whole council area including adult social care and average parish precepts, which MHCLG publishes on the same basis for every class of council in Table 9. Illustrative boundaries, not property or billing boundaries.
Map detail: England features only. ArcGIS generalisation tolerance 0.001 degrees, five decimal places. Illustrative boundaries, not property or billing boundaries. Joined by exact LAD26CD only.
How has Band D in Birmingham changed?
Ministry of Housing, Communities and Local Government Band D Council Tax figures, Area_CT. Full reference
Cash figures, not adjusted for inflation. Includes average parish precepts, so the Band D bill in any one parish or unparished part of Birmingham can differ from this figure.
Published Band D values
Show the 34 published values
| Year | Band D |
|---|---|
| 1993/94 | £657 |
| 1994/95 | £632 |
| 1995/96 | £673 |
| 1996/97 | £749 |
| 1997/98 | £794 |
| 1998/99 | £846 |
| 1999/00 | £893 |
| 2000/01 | £938 |
| 2001/02 | £979 |
| 2002/03 | £1,026 |
| 2003/04 | £1,079 |
| 2004/05 | £1,106 |
| 2005/06 | £1,139 |
| 2006/07 | £1,164 |
| 2007/08 | £1,189 |
| 2008/09 | £1,213 |
| 2009/10 | £1,238 |
| 2010/11 | £1,261 |
| 2011/12 | £1,261 |
| 2012/13 | £1,261 |
| 2013/14 | £1,269 |
| 2014/15 | £1,294 |
| 2015/16 | £1,320 |
| 2016/17 | £1,380 |
| 2017/18 | £1,446 |
| 2018/19 | £1,510 |
| 2019/20 | £1,601 |
| 2020/21 | £1,668 |
| 2021/22 | £1,756 |
| 2022/23 | £1,816 |
| 2023/24 | £1,913 |
| 2024/25 | £2,091 |
| 2025/26 | £2,245 |
| 2026/27 | £2,363 |
Ministry of Housing, Communities and Local Government Band D Council Tax figures, Area_CT. Full reference
Discounts, exemptions and how to pay in Birmingham
Discounts and exemptions depend on who lives in the home and the home itself. A household with one counted adult may get a 25% discount, and some people and some homes are not counted or are exempt. This site does not decide eligibility. Discounts, reductions and who is counted.
If paying is difficult, contact the council early. If paying is difficult.
Pay or manage your council tax on Birmingham City Council's website.
Link from GOV.UK Local Links Manager, service “Pay your Council Tax” (LGSL 57), export of 11 November 2026, checked by UK Places on 11 November 2026.
Help with your bill · What council tax band am I? · Find your property band on GOV.UK · Find your council for your exact bill.
Check the payment dates on your bill. How council tax is paid.
Who sets council tax in Birmingham?
The figures below show each council's own share and its published annual change. The national breakdown above also identifies police, fire and combined-authority charges for this billing area.
Parish and local precepts in Birmingham
The 2026/27 return lists 2 local precepting authorities in Birmingham. 2 set a Band D precept, from £34.76 (New Frankley in Birmingham) to £69.96 (Sutton Coldfield).
Every parish precept in Birmingham, with its change on 2025/26
Full Band D by parish and unparished area in West Midlands, every charge added up for each area.
MHCLG Town and parish council tax statistics, Parish_Level_Data. Full reference
How many properties are in each band in Birmingham?
Domestic properties on the Council Tax valuation list in Birmingham at 31 March 2026, by band. This counts properties on the list, not households paying the charges above, and it is not the tax base used to set them.
91.6% of properties in Birmingham are in Band D or below, against 80.8% across England.
| Band | Properties in Birmingham | Share in Birmingham | Share in England |
|---|---|---|---|
| A | 165,150 | 35.2% | 23.6% |
| B | 133,030 | 28.4% | 19.5% |
| C | 86,290 | 18.4% | 22.0% |
| D | 45,140 | 9.6% | 15.7% |
| E | 23,610 | 5.0% | 9.9% |
| F | 9,150 | 1.9% | 5.2% |
| G | 5,950 | 1.3% | 3.5% |
| H | 940 | 0.2% | 0.6% |
| All properties | 469,240 | 25,936,540 in England |
HMRC rounds every count to the nearest 10, so the bands may not add exactly to the total.Each share is the band's printed count divided by the printed total of all properties, to one decimal place. The table also covers Wales, which has its own bands including Band I, so the England comparison leaves Wales out; Scotland and Northern Ireland are not in it.
Shares calculated by UK Council Tax from the printed counts: HM Revenue & Customs Council Tax stock of properties, table CTSOP1.1. Full reference
How much council tax did Birmingham collect in 2025/26?
The council collects council tax for every body that sets a share of the bill, so these amounts cover the whole bill, not only the council's own share. Figures are as the council reported them to MHCLG on its year end return.
Birmingham collected 90.04% of the council tax due for 2025/26 by 31 March 2026, against 95.60% across England.
| QRC4 line | Birmingham | England |
|---|---|---|
| In-year collection rate (line 5) | 90.04% | 95.60% |
| Council tax collectable for 2025/26 (line 1) | £629,022 thousand | £44,981,384 thousand |
| Collected for 2025/26 by 31 March 2026 (line 4) | £566,351 thousand | £43,002,543 thousand |
| Arrears for 2025/26 outstanding at 31 March 2026 (line 23) | £78,894 thousand | £2,164,414 thousand |
| Arrears for 2024/25 and earlier years outstanding at 31 March 2026 (line 20) | £193,788 thousand | £5,259,524 thousand |
| Total arrears outstanding at 31 March 2026 (line 24) | £272,682 thousand | £7,423,938 thousand |
The in-year collection rate is line 4 divided by line 1, as calculated and printed by MHCLG to 2 decimal places. Amounts are printed in thousands of pounds, rounded to the nearest thousand. Arrears are amounts not yet collected at 31 March 2026; councils can still collect them in later years, so they are not amounts lost. The England column is the total for all 296 billing authorities in England. A figure the table does not hold is shown as not published, never as zero.
- MHCLG note for England: Figures for 2025-26 have been revised to include data for Kensington & Chelsea who were unable to submit data in time for the original June publication. This addition changes all figures for England and London aggregates. Small arrears revisions were also made for Bradford (in Table 9b) and Stoke-on-Trent (in Table 9a). The affected cells are named for these changes.
MHCLG Collection rates for Council Tax, Table 9a. Full reference
Where the money goes
The largest positive service headings in Birmingham's 2026/27 budget, ranked by net current expenditure. This is net of sales, fees, charges and transfers; NHS-funded spending is excluded. Negative totals are shown as net income on the budget page.
- Education Services: £1,117,292,000 (RA line 190).
- Adult Social Care: £573,142,000 (RA line 360).
- Children's Social Care: £410,088,000 (RA line 330).
Ministry of Housing, Communities and Local Government Revenue expenditure and financing, 2026/27 budget, RA_LA_Data_2026-27. Full reference
Nearby and alike
Explore neighbouring areas and councils of the same type.
Neighbouring council areas
Areas whose outlines touch or cross in the England map. The map is simplified and clipped to the coastline, so a short shared border, or an area across the sea, an estuary or a tidal river, may not appear.
Source: Office for National Statistics, Local Authority Districts (May 2026) Boundaries UK BSC.
Councils of the same type
Other metropolitan districts in West Midlands, by council type in the UK Places register.
Next steps
Birmingham across the network
- Birmingham's council profile on UK Councils
- Birmingham on UK Places: the place, its boundaries and services
- Birmingham had 1,176,960 residents at mid-2025: the area's population on UK Demographics
Source: Office for National Statistics, Population estimates for the UK, England, Wales, Scotland and Northern Ireland: mid-2025, MYE2 Persons, published 1 October 2026.
- Birmingham's next scheduled council election is in 2030: seats and results on UK Elections
Source: Birmingham City Council, Birmingham City Council election on 7 May 2026 (page updated 8 June 2026); corroborated by City of Birmingham (Scheme of Elections) Order 2015, SI 2015/43, art.2 as amended by SI 2015/666, recorded in UK Elections' council election register, checked 24 October 2026.
Sources
Published charges by band, 2026/27. Area averages including average parish precepts, in pounds and pence. The divided by 10 and by 12 columns are our calculation from the yearly charge, rounded to the penny.
MHCLG, Council Tax levels set by local authorities in England 2026 to 2027, Table 9, published 25 March 2026.
Change on 2025/26 by band. Calculated from two published tables.
MHCLG, Council Tax levels set by local authorities in England 2026 to 2027, Table 9, and Table 9 for 2025 to 2026, published 25 March 2026.
England and area type averages of area Band D, 2026/27.
MHCLG, Council Tax levels set by local authorities in England 2026 to 2027, Table 7, published 25 March 2026.
Position of Birmingham within metropolitan districts. Positions calculated from the published figures, counted from the lowest: equal figures share a position.
MHCLG, Council Tax levels set by local authorities in England 2026 to 2027, Table 9 and Table 8a, published 25 March 2026.
The council's own Band D.
MHCLG, Council Tax levels set by local authorities in England 2026 to 2027, Table 8a, published 25 March 2026.
Band D history.
Ministry of Housing, Communities and Local Government, Band D Council Tax figures 1993 onwards, revised April 2026, Area_CT, retrieved 5 October 2026.
Parish and local precepts.
MHCLG, Council Tax statistics for town and parish councils in England: 2026 to 2027, Parish_Level_Data and Notes, retrieved 5 October 2026.
Properties in each band. Shares calculated by UK Council Tax from the printed counts.
HM Revenue & Customs, Council Tax: stock of properties, 2026, table CTSOP1.1, properties on the valuation list at 31 March 2026, 2026 edition, published 24 September 2026.
Collection rates and arrears.
MHCLG, Collection rates for Council Tax and non-domestic rates in England, 2025 to 2026, Table 9a (QRC4 lines 1, 4, 5, 20, 23 and 24), 2025 to 2026, revised 31 July 2026, published 24 June 2026.
Where the money goes, 2026/27 budget.
Ministry of Housing, Communities and Local Government, Local authority revenue expenditure and financing England: 2026 to 2027 budget individual local authority data, RA_LA_Data_2026-27, published 11 June 2026.