Five rounds of guessing: how Waverley splits each pound it spends on services, how the county council splits its own, who takes your Band D bill, where the money comes from, and what happens to reserves.
Each round can be skipped. Answers and sources follow each round; the full published tables remain below.
1Council servicesSplit each pound Waverley spends on services.
2County servicesSplit each pound the county council spends on services.
3Your billGuess who takes each part of a Band D bill.
4FundingGuess where the money comes from.
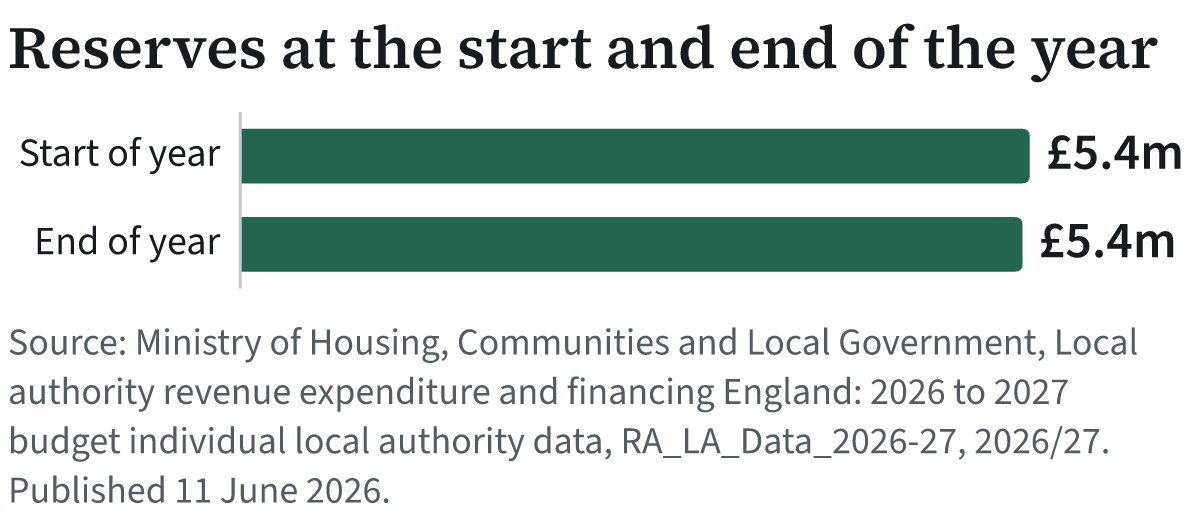
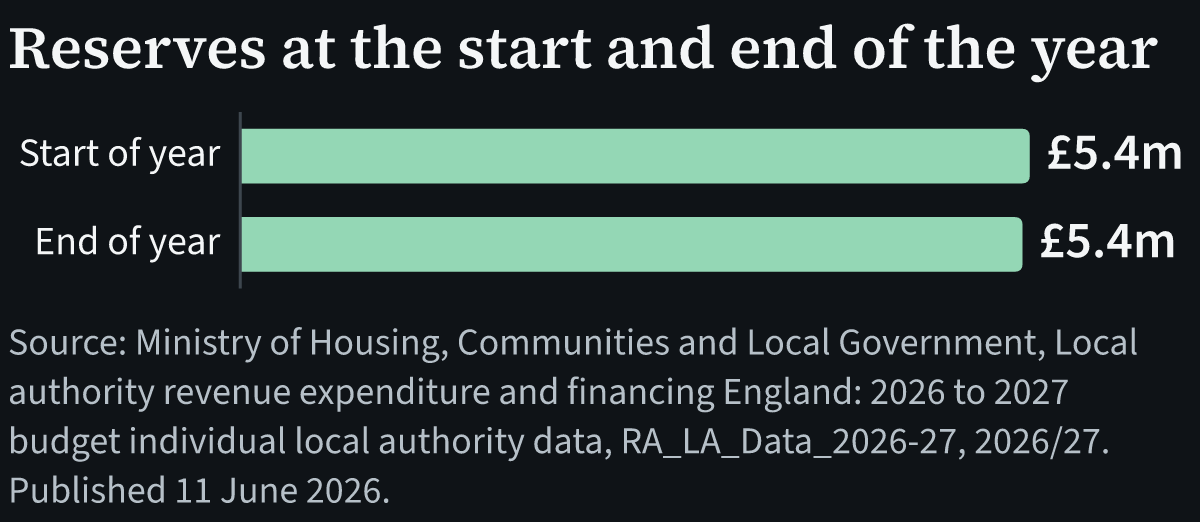
5ReservesGuess what happens to reserves.
1Council
2County
3Bill
4Funding
5Reserves
The figures as a table
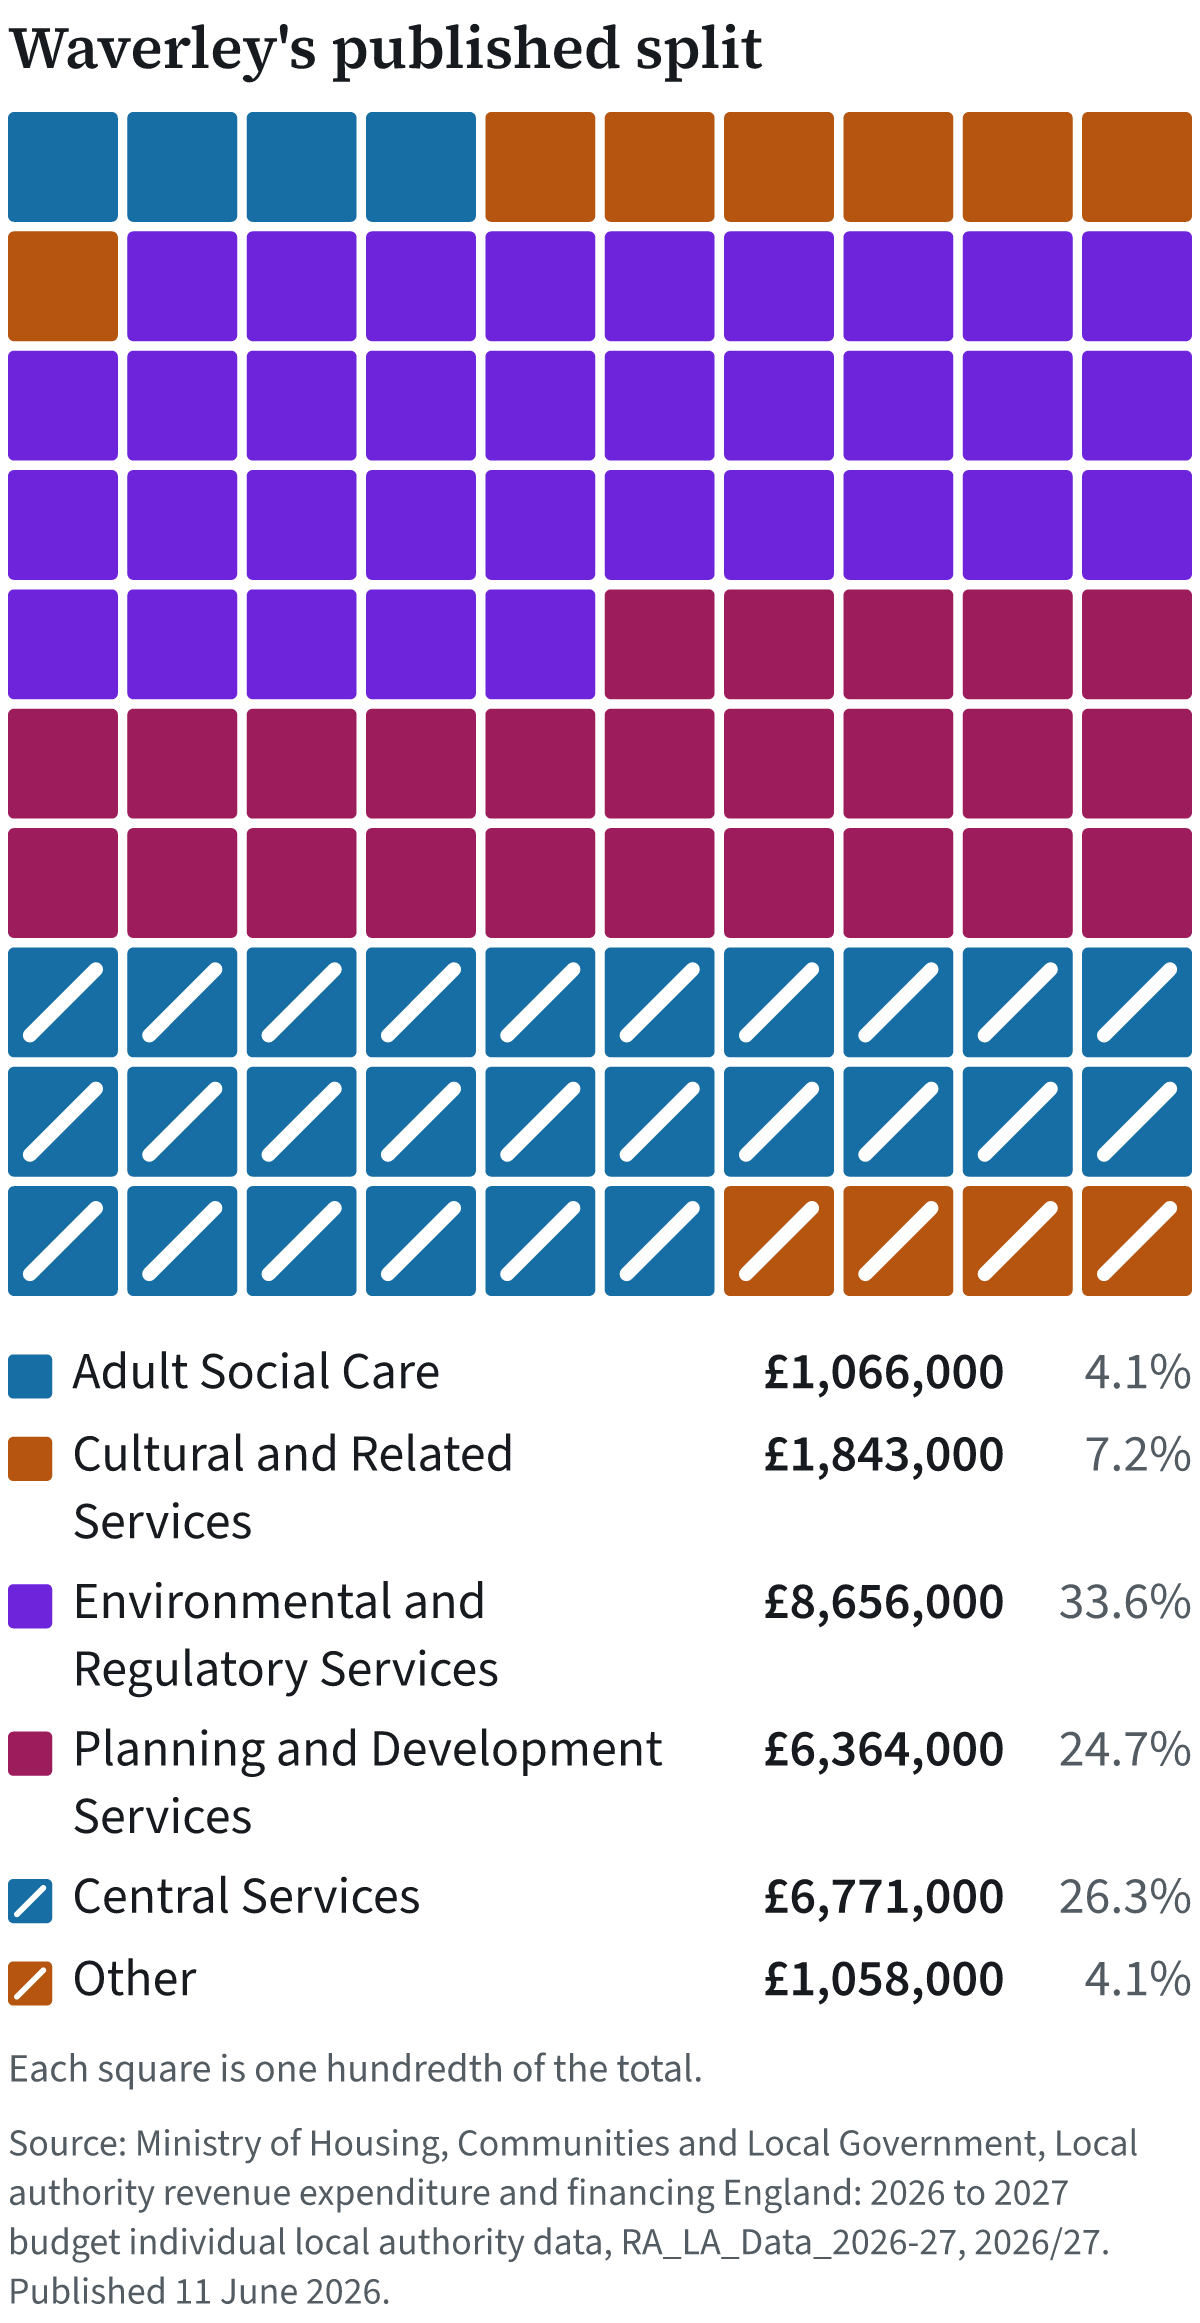
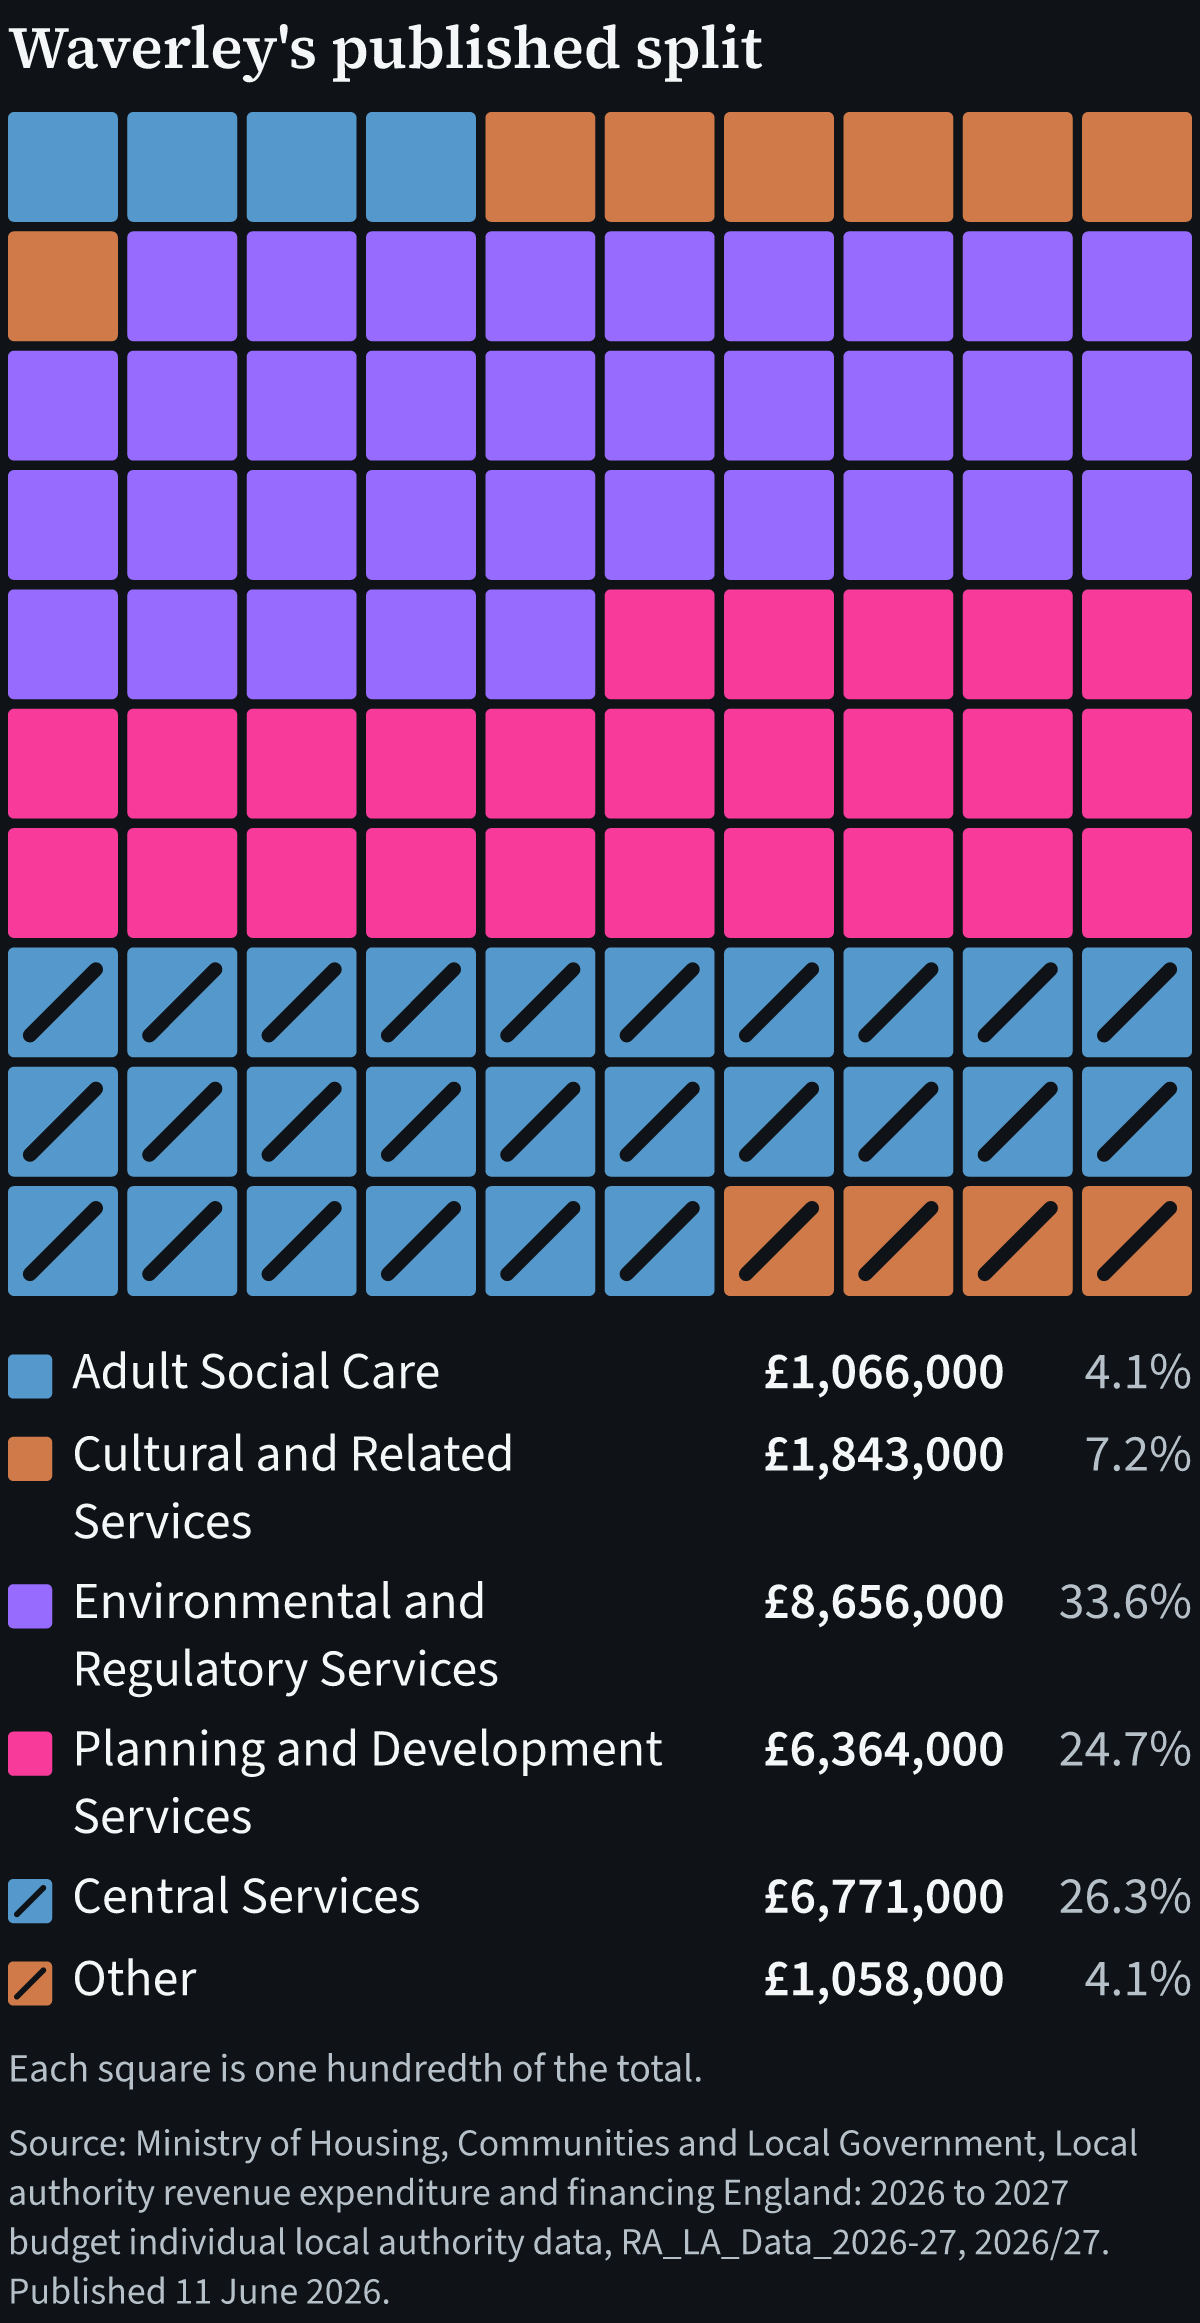
Waverley's published split
Amount
Share
Squares
Adult Social Care
£1,066,000
4.1%
4
Cultural and Related Services
£1,843,000
7.2%
7
Environmental and Regulatory Services
£8,656,000
33.6%
34
Planning and Development Services
£6,364,000
24.7%
25
Central Services
£6,771,000
26.3%
26
Other
£1,058,000
4.1%
4
Source: Ministry of Housing, Communities and Local Government, Local authority revenue expenditure and financing England: 2026 to 2027 budget individual local authority data, RA_LA_Data_2026-27, 2026/27. Published 11 June 2026.
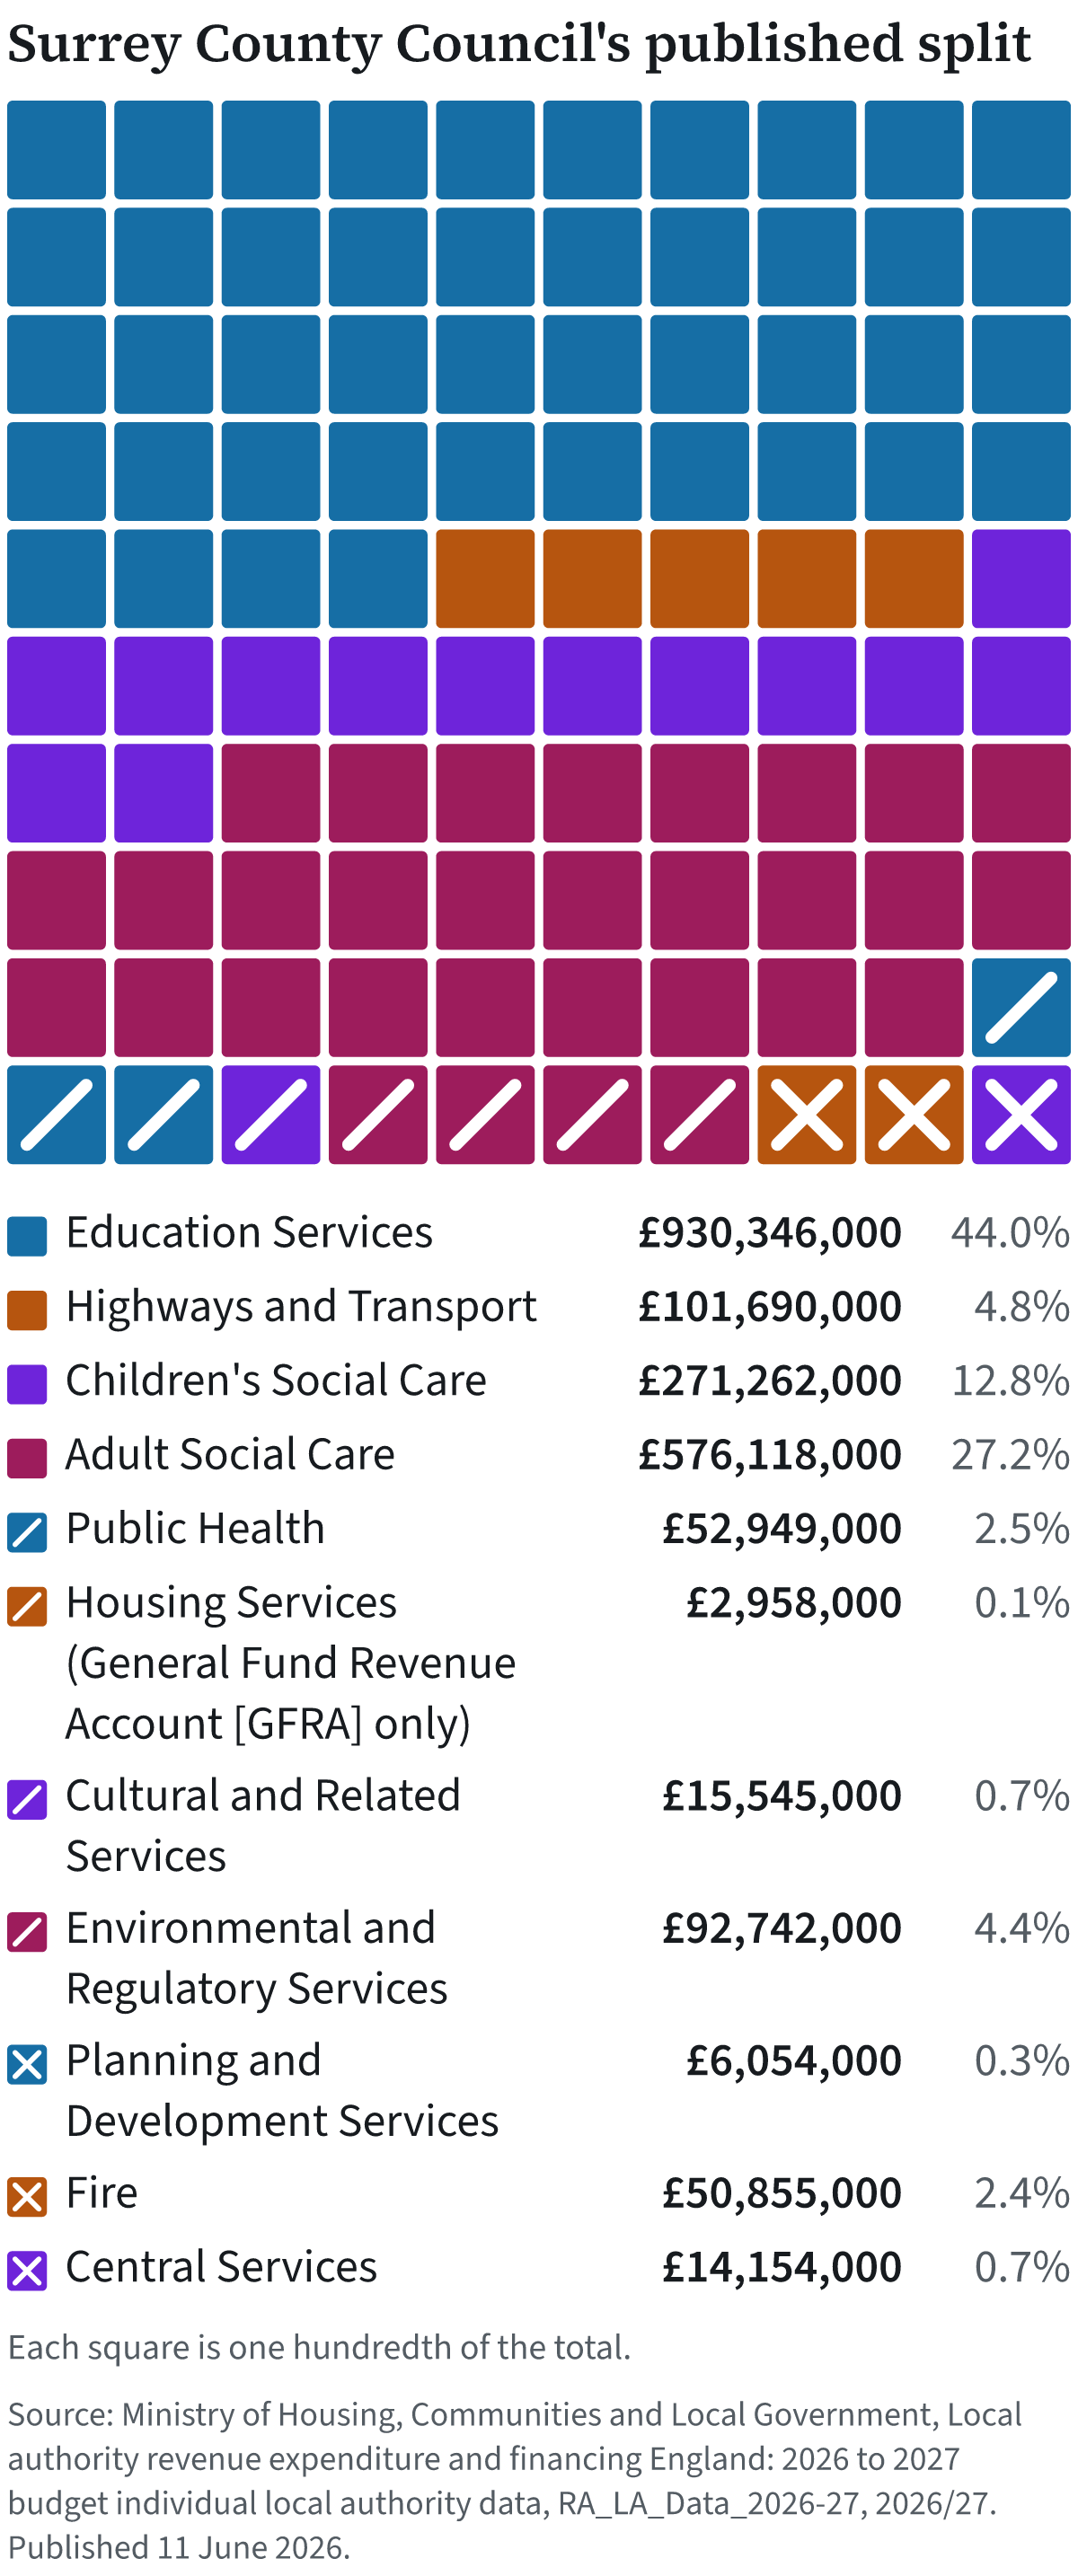
Housing Services (General Fund Revenue Account [GFRA] only)
£2,958,000
0.1%
0
Cultural and Related Services
£15,545,000
0.7%
1
Environmental and Regulatory Services
£92,742,000
4.4%
4
Planning and Development Services
£6,054,000
0.3%
0
Fire
£50,855,000
2.4%
2
Central Services
£14,154,000
0.7%
1
Source: Ministry of Housing, Communities and Local Government, Local authority revenue expenditure and financing England: 2026 to 2027 budget individual local authority data, RA_LA_Data_2026-27, 2026/27. Published 11 June 2026.
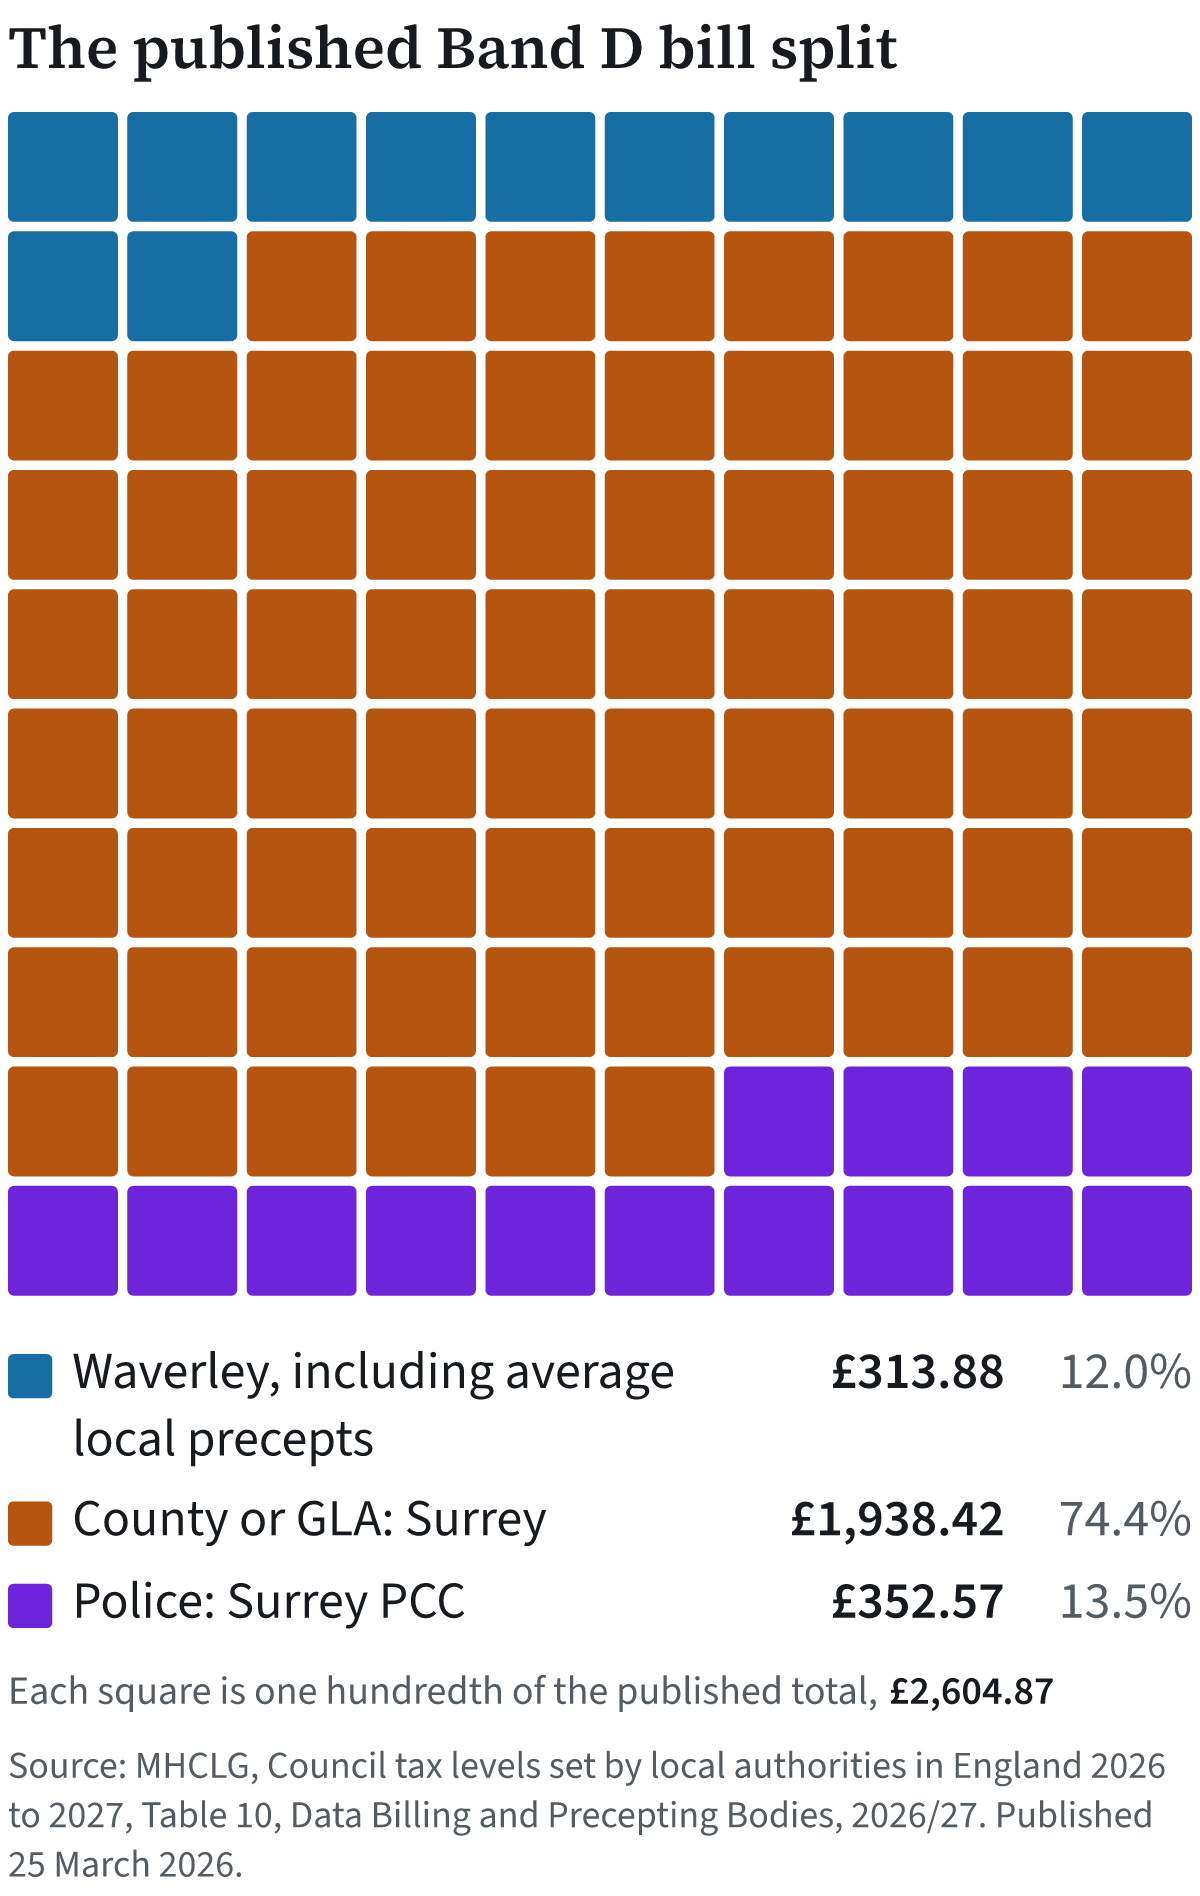
Source: MHCLG, Council tax levels set by local authorities in England 2026 to 2027, Table 10, Data Billing and Precepting Bodies, 2026/27. Published 25 March 2026.
Source: Ministry of Housing, Communities and Local Government, Local authority revenue expenditure and financing England: 2026 to 2027 budget individual local authority data, RA_LA_Data_2026-27, 2026/27. Published 11 June 2026.
Source: Ministry of Housing, Communities and Local Government, Local authority revenue expenditure and financing England: 2026 to 2027 budget individual local authority data, RA_LA_Data_2026-27, 2026/27. Published 11 June 2026.
Source: Ministry of Housing, Communities and Local Government, Local authority revenue expenditure and financing England: 2026 to 2027 budget individual local authority data, RA_LA_Data_2026-27, 2026/27. Published 11 June 2026.
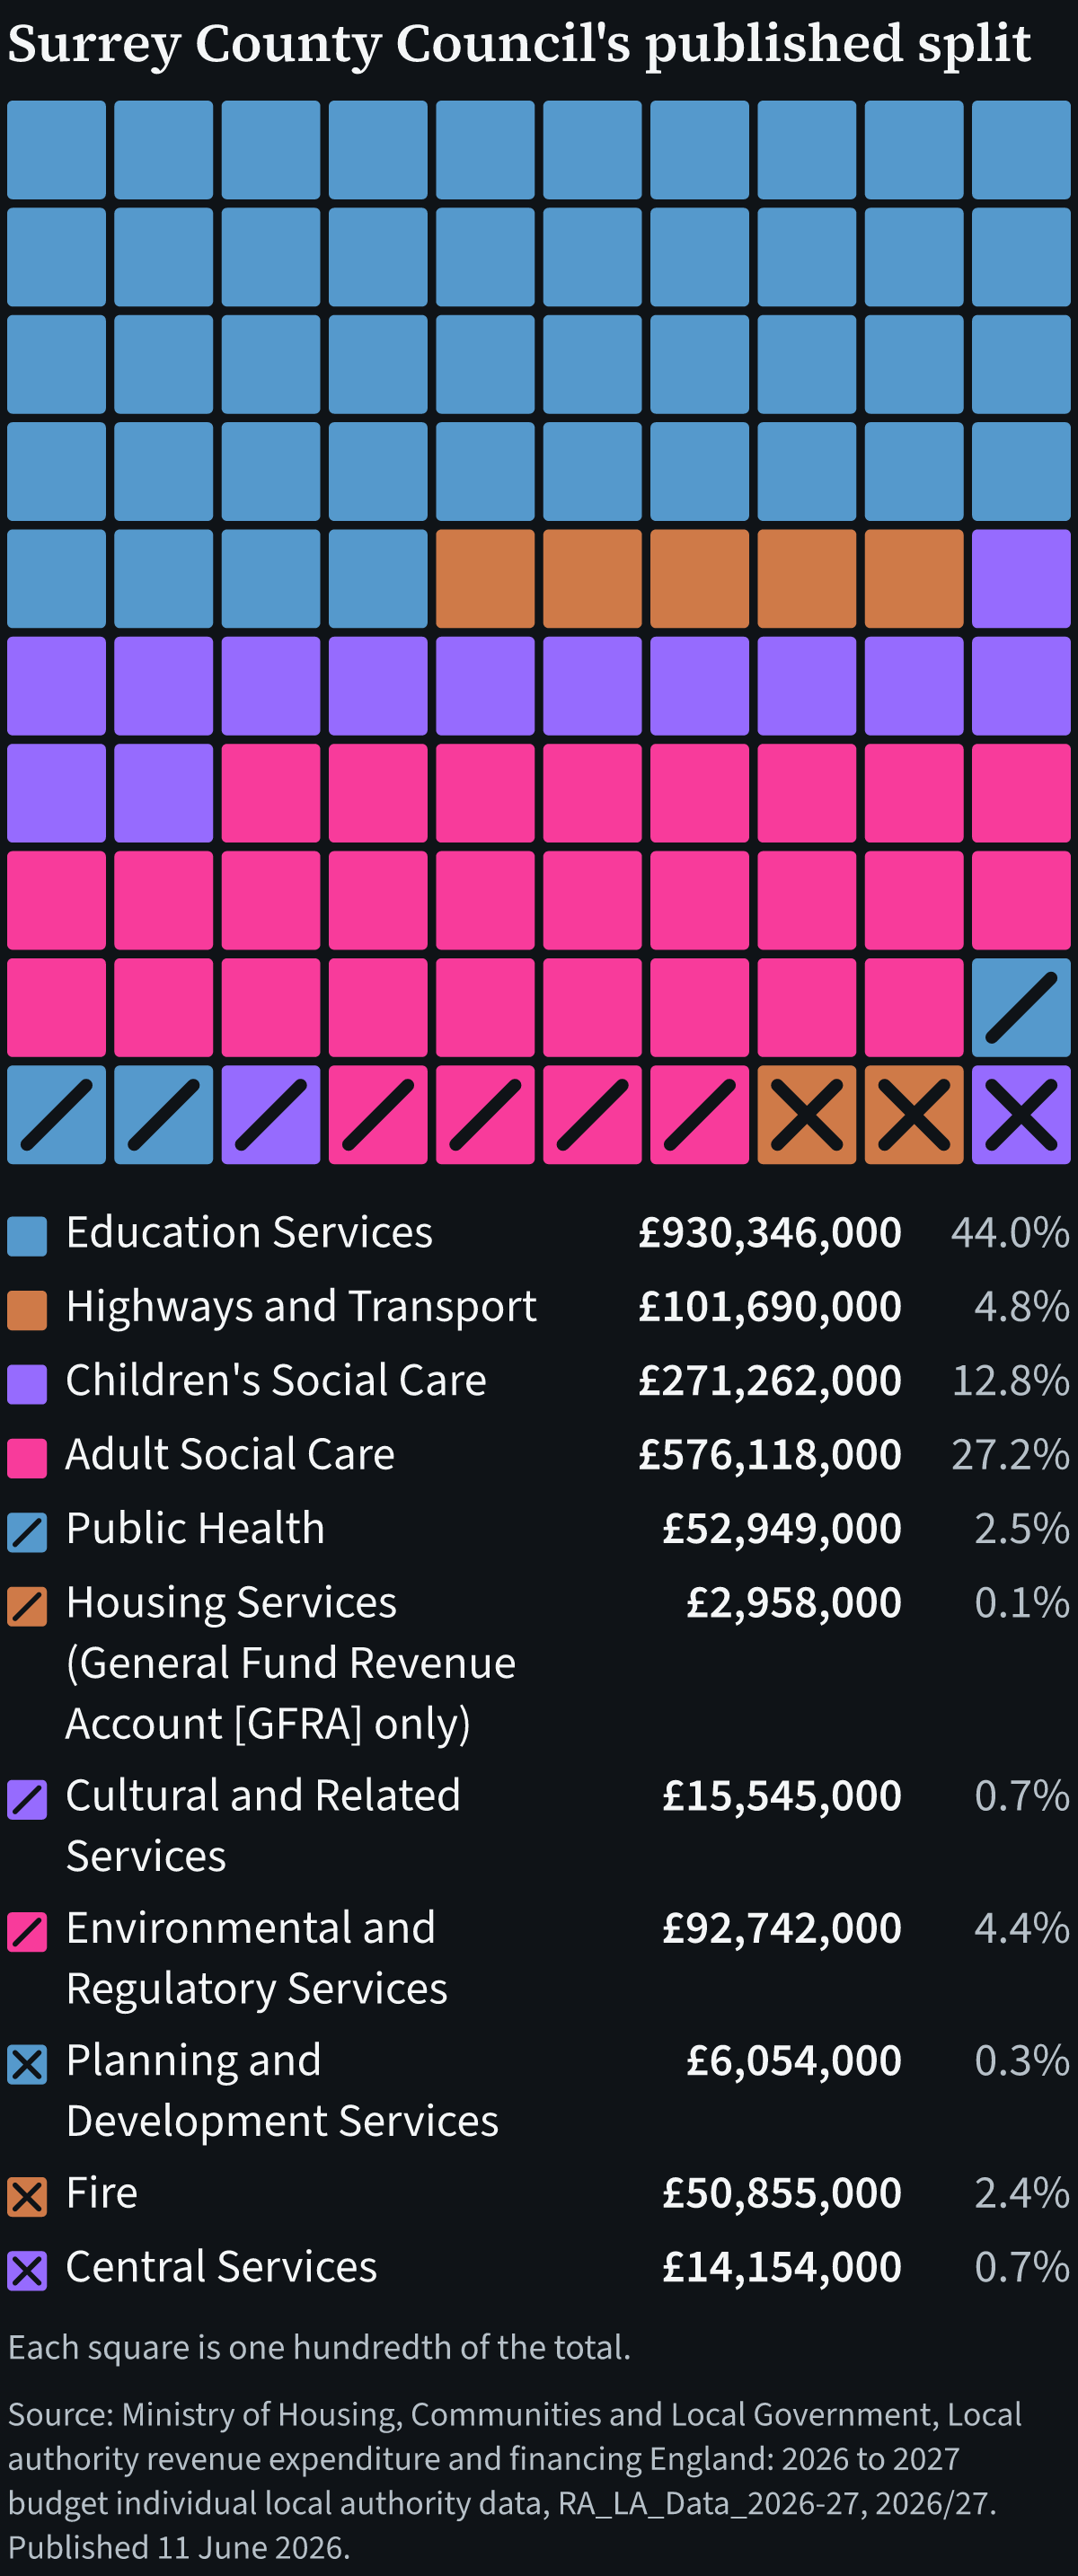
Housing Services (General Fund Revenue Account [GFRA] only)
£2,958,000
0.1%
0
Cultural and Related Services
£15,545,000
0.7%
1
Environmental and Regulatory Services
£92,742,000
4.4%
4
Planning and Development Services
£6,054,000
0.3%
0
Fire
£50,855,000
2.4%
2
Central Services
£14,154,000
0.7%
1
Source: Ministry of Housing, Communities and Local Government, Local authority revenue expenditure and financing England: 2026 to 2027 budget individual local authority data, RA_LA_Data_2026-27, 2026/27. Published 11 June 2026.
Source: MHCLG, Council tax levels set by local authorities in England 2026 to 2027, Table 10, Data Billing and Precepting Bodies, 2026/27. Published 25 March 2026.
Source: Ministry of Housing, Communities and Local Government, Local authority revenue expenditure and financing England: 2026 to 2027 budget individual local authority data, RA_LA_Data_2026-27, 2026/27. Published 11 June 2026.
Source: Ministry of Housing, Communities and Local Government, Local authority revenue expenditure and financing England: 2026 to 2027 budget individual local authority data, RA_LA_Data_2026-27, 2026/27. Published 11 June 2026.
Observed budget: net current expenditure by service. Figures are net of sales, fees and charges, and transfers between local authorities and from other delivery bodies. NHS-funded expenditure, such as through the Better Care Fund, is excluded.
Amounts are shown in pounds, converted from the printed whole thousands of pounds. Zero service headings are omitted; a negative service total is labelled net income.
Waverley: net current expenditure by service, 2026/27
MHCLG service heading
RA line
Pounds
Highways and Transport
290
-£4,305,000net income
Children's Social Care
330
-£15,000net income
Adult Social Care
360
£1,066,000
Housing Services (General Fund Revenue Account [GFRA] only)
Special schools and alternative provision (RA line 140): £0. SEND spending also sits in other education and transport lines; this return does not total it.
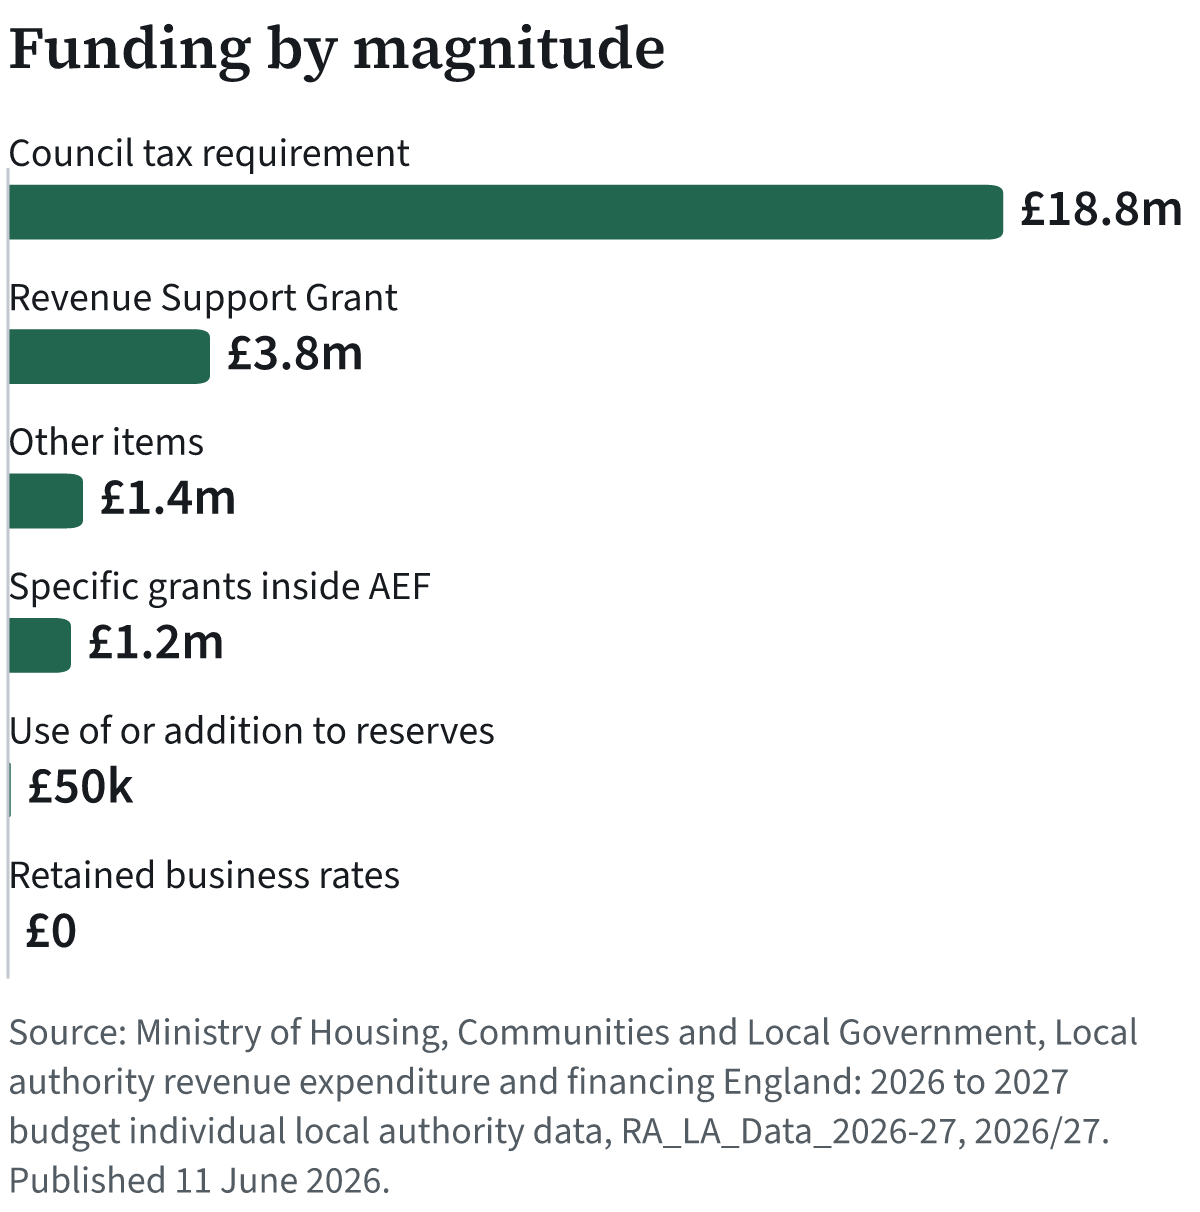
Revenue expenditure is a different measure from service expenditure. The funding view below rearranges MHCLG's financing identity: line 900 plus lines 904 to 985 equals line 990. Amounts are positive magnitudes; the direction shows which are added or deducted to reach revenue expenditure. An addition to reserves is deducted from available funding.
Waverley: calculated funding view of revenue expenditure, 2026/27
Council tax requirement includes parish precepts. This RA budget figure and the Table 10 bill figures are separate returns; neither has been adjusted to force agreement. The funding reserves group includes the financing lines for schools, DSG and public health as well as other earmarked and unallocated reserves. The non-ringfenced balances below use only other earmarked and unallocated reserves.
Read the financing lines as printed
Waverley: observed RA financing lines, 2026/27, with printed signs
Printed label
RA line
Pounds
REVENUE EXPENDITURE
900
£22,476,000
Specific and special grants inside AEF [SG line 699 as income]
904
-£1,191,000
Inter-authority transfers in respect of reorganisation
906
£0
Appropriations to(+)/ from(-) schools' reserves
911
£0
Appropriations to(+)/ from(-) dedicated schools grant reserves
913
£0
Appropriations to(+)/ from(-) public health financial reserves
914
£0
Appropriations to(+)/ from(-) other earmarked financial reserves
Observed budget: net current expenditure by service. Figures are net of sales, fees and charges, and transfers between local authorities and from other delivery bodies. NHS-funded expenditure, such as through the Better Care Fund, is excluded.
Amounts are shown in pounds, converted from the printed whole thousands of pounds. Zero service headings are omitted; a negative service total is labelled net income.
Surrey: net current expenditure by service, 2026/27
MHCLG service heading
RA line
Pounds
Education Services
Most schools spending is paid for by the Dedicated Schools Grant, a ring-fenced government grant: £666,556,000 in 2026/27.
Special schools and alternative provision (RA line 140): £211,007,000. SEND spending also sits in other education and transport lines; this return does not total it.
Revenue expenditure is a different measure from service expenditure. The funding view below rearranges MHCLG's financing identity: line 900 plus lines 904 to 985 equals line 990. Amounts are positive magnitudes; the direction shows which are added or deducted to reach revenue expenditure. An addition to reserves is deducted from available funding.
Surrey: calculated funding view of revenue expenditure, 2026/27
Council tax requirement includes parish precepts. This RA budget figure and the Table 10 bill figures are separate returns; neither has been adjusted to force agreement. The funding reserves group includes the financing lines for schools, DSG and public health as well as other earmarked and unallocated reserves. The non-ringfenced balances below use only other earmarked and unallocated reserves.
Read the financing lines as printed
Surrey: observed RA financing lines, 2026/27, with printed signs
Printed label
RA line
Pounds
REVENUE EXPENDITURE
900
£2,087,793,000
Specific and special grants inside AEF [SG line 699 as income]
904
-£794,324,000
Inter-authority transfers in respect of reorganisation
906
£0
Appropriations to(+)/ from(-) schools' reserves
911
£0
Appropriations to(+)/ from(-) dedicated schools grant reserves
913
£0
Appropriations to(+)/ from(-) public health financial reserves
914
£0
Appropriations to(+)/ from(-) other earmarked financial reserves
These figures use the county’s budget and the ONS county population. No social care ratio is calculated for Waverley district.
A ratio is a budget divided by a head count. It does not measure need, efficiency, value or spending on an individual recipient.
Adult social care per adult
£582
Calculated from £576,118,000 divided by 989,683 residents aged 18 and over. Shown to the nearest pound.
MHCLG RA budget 2026/27, Part 1, lines 360; ONS population estimates, mid-2025, MYE2 Persons.
The population estimate is for mid-2025; the budget is for 2026/27.
Lines used in this calculation
Line 360: TOTAL ADULT SOCIAL CARE.
Adult social care attributed to working-age adults, per resident aged 18 to 64
£344
Calculated from £255,981,000 divided by 744,661 residents aged 18 to 64. Shown to the nearest pound.
MHCLG RA budget 2026/27, Part 1, lines 332, 334, 336, 340, 344; ONS population estimates, mid-2025, MYE2 Persons.
The population estimate is for mid-2025; the budget is for 2026/27.
Lines used in this calculation
Line 332: Physical support: adults (18 to 64).
Line 334: Sensory support: adults (18 to 64).
Line 336: Support with memory and cognition: adults (18 to 64).
Line 340: Learning disability support: adults (18 to 64).
Line 344: Mental health support: adults (18 to 64).
Adult social care attributed to older people, per resident aged 65 and over
£851
Calculated from £208,588,000 divided by 245,022 residents aged 65 and over. Shown to the nearest pound.
MHCLG RA budget 2026/27, Part 1, lines 333, 335, 337, 341, 345; ONS population estimates, mid-2025, MYE2 Persons.
The population estimate is for mid-2025; the budget is for 2026/27.
Lines used in this calculation
Line 333: Physical support: older people (65+).
Line 335: Sensory support: older people (65+).
Line 337: Support with memory and cognition: older people (65+).
Line 341: Learning disability support: older people (65+).
Line 345: Mental health support: older people (65+).
Children’s social care per child
£1,021
Calculated from £271,262,000 divided by 265,572 residents under 18. Shown to the nearest pound.
MHCLG RA budget 2026/27, Part 1, lines 330; ONS population estimates, mid-2025, MYE2 Persons.
The population estimate is for mid-2025; the budget is for 2026/27.
Lines used in this calculation
Line 330: TOTAL CHILDREN'S SOCIAL CARE.
Adult social care not attributed by age
£111,549,000 (19.4% of adult social care line 360).
Calculated as adult social care line 360 (£576,118,000) less the ten age lines above. The share is this amount divided by line 360, multiplied by 100 and shown to one decimal place. This covers social support, assistive equipment, assessment and safeguarding, information and early intervention, and commissioning.
The two age ratios use different populations and exclude this amount. They do not add up to the adult ratio.
Published Band D area averages for 2026/27. Parish charges are averaged into the council line and already included in the total. Do not add them again. An area average is not an exact bill for an address.
Waverley: published Band D bill components, 2026/27
The council's own Band D, excluding local precepts, is £220.25. This is a separate measure, not an additional charge.
Adult social care is included in council charges. Police and fire may be funded within another line. A zero separate precept does not mean the service is absent.
Published whole-bill charges by band
Choose a band to read its published area average. The component breakdown above is available for Band D only; other bands' component charges are not inferred.
Band A, 2026/27, for the year£1,736.58£173.66 a month over ten instalments, rounded