Full Band D | 2026/27 | 29 areas
Council tax by parish and unparished area in Peterborough 2026/27
Full Band D council tax for every parish and unparished area in Peterborough, 29 of 29 with a figure, lowest first. Calculated from published MHCLG figures, or the council's own where it publishes them.
Difference £135.14 a year at Band D, £11.26 a month.
Full Band D, positions and differences calculated from: MHCLG Council tax levels 2026/27, Table 10; MHCLG Town and parish council tax 2026/27. Full reference
The five lowest full Band D figures in Peterborough are City, Peterborough (£2,279.25); St. Martin's Without, Peterborough (£2,279.25); Upton, Peterborough (£2,279.25); Wothorpe, Peterborough (£2,279.25) and Orton Longueville, Peterborough (£2,292.25). The five highest full Band D figures in Peterborough are Sutton, Peterborough (£2,414.39); Castor, Peterborough (£2,366.25); Bainton, Peterborough (£2,361.22); Wansford, Peterborough (£2,359.70) and Wittering, Peterborough (£2,356.82).
Full Band D calculated from: MHCLG Council tax levels 2026/27, Table 10; MHCLG Town and parish council tax 2026/27. Full reference
Where is council tax cheapest and most expensive in Peterborough?
Full Band D for 29 parish and unparished areas in Peterborough with a figure, lowest first. Position 1 is the lowest. Each name opens its row in the full table.
Lowest ten
- 1=CityPeterborough, Peterborough£2,279.25
- 1=St. Martin's WithoutPeterborough, Peterborough£2,279.25
- 1=UptonPeterborough, Peterborough£2,279.25
- 1=WothorpePeterborough, Peterborough£2,279.25
- 5Orton LonguevillePeterborough, Peterborough£2,292.25
- 6MarholmPeterborough, Peterborough£2,296.69
- 7Hampton Hargate and ValePeterborough, Peterborough£2,304.33
- 8Orton WatervillePeterborough, Peterborough£2,306.67
- 9EyePeterborough, Peterborough£2,317.29
- 10ThorneyPeterborough, Peterborough£2,318.03
Highest ten
- 29SuttonPeterborough, Peterborough£2,414.39
- 28CastorPeterborough, Peterborough£2,366.25
- 27BaintonPeterborough, Peterborough£2,361.22
- 26WansfordPeterborough, Peterborough£2,359.70
- 25WitteringPeterborough, Peterborough£2,356.82
- 24UffordPeterborough, Peterborough£2,352.60
- 23ThornhaughPeterborough, Peterborough£2,347.78
- 22SouthorpePeterborough, Peterborough£2,346.27
- 21HelpstonPeterborough, Peterborough£2,345.85
- 20BrettonPeterborough, Peterborough£2,338.83
Full Band D, positions and differences calculated from: MHCLG Council tax levels 2026/27, Table 10; MHCLG Town and parish council tax 2026/27. Full reference
How the 29 figures in Peterborough spread
The figures as a table
| Full Band D by parish and unparished area in Peterborough, 2026/27 | How | |
|---|---|---|
| City, Peterborough | £2,279.25 | Published |
| Lowest of the 29 | £2,279.25 | Published |
| Median | £2,329.25 | Calculated from the 29 published values |
| 90th percentile | £2,360.00 | Calculated from the 29 published values |
| Highest of the 29 | £2,414.39 | Published |
| Median and 90th percentile calculated from the published values of the 29 parish and unparished areas, by linear interpolation. Basis: Full Band D, including the parish precept; the marked area has the largest tax base (for an unparished area, the tax base of the council less that of its parishes). Source: MHCLG, Council tax levels set by local authorities in England 2026 to 2027: Table 10, Table 10 Data_Billing and Parish_Level_Data, retrieved 5 October 2026. | ||
Source: MHCLG, Council tax levels set by local authorities in England 2026 to 2027: Table 10, Table 10 Data_Billing and Parish_Level_Data, retrieved 5 October 2026.
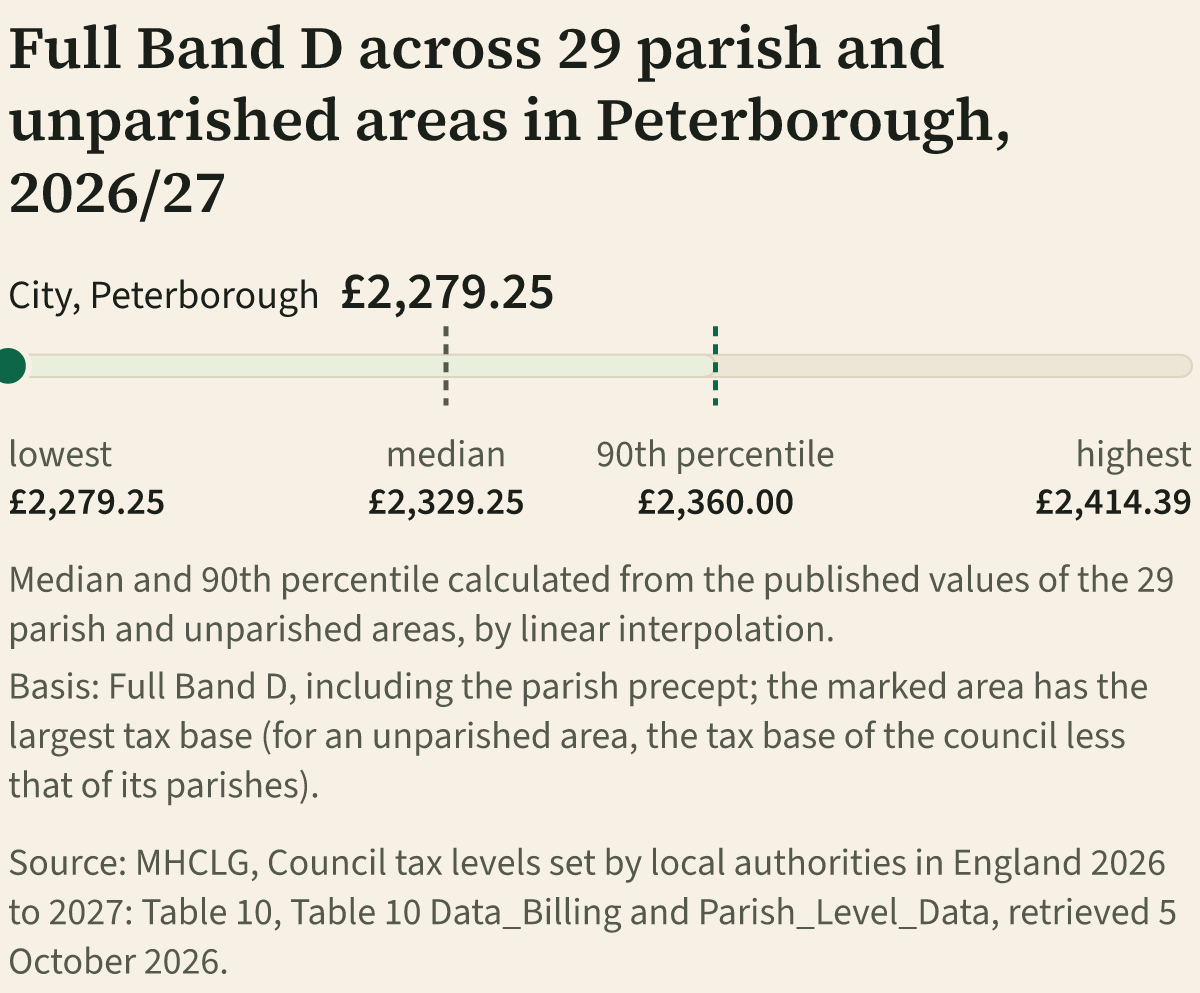
Each area's full Band D sits on one scale from the lowest to the highest. The median, the middle figure, and the 90th percentile are calculated from the areas' own figures. The marked area is the one with the largest tax base, City, Peterborough; an unparished area's tax base is our calculation, the council's tax base less its parishes'. In the table under the chart, "Published" marks a figure taken from this page's own table, where each full Band D is calculated as the method note sets out.
Every parish and unparished area, lowest to highest
29 areas have a full Band D and are in position order. Every area here has a full Band D. Full Band D is the whole Band D bill in that area: the billing council, the county or GLA, police, fire and combined authority, and the parish. It is before discounts, reductions and premiums.
Council, constituency, sort and larger places
All 29 areas shown.
| Position | Place | Council and constituency | LowestHighestWhere the full Band D sits between the lowest and highest in Peterborough | Full Band D | Parish part | Parish change | Status |
|---|---|---|---|---|---|---|---|
| 1= | CityNon-precepting parish | PeterboroughNot matched | £2,279.25 | £0.00 | £0.00 | Calculated | |
| 1= | St. Martin's WithoutNon-precepting parish | PeterboroughNorth West Cambridgeshire | £2,279.25 | £0.00 | £0.00 | Calculated | |
| 1= | UptonNon-precepting parish | PeterboroughNorth West Cambridgeshire | £2,279.25 | £0.00 | £0.00 | Calculated | |
| 1= | WothorpeNon-precepting parish | PeterboroughNorth West Cambridgeshire | £2,279.25 | £0.00 | £0.00 | Calculated | |
| 5 | Orton LonguevillePrecepting parish | PeterboroughNorth West Cambridgeshire | £2,292.25 | £13.00 | +£1.04 | Calculated | |
| 6 | MarholmPrecepting parish | PeterboroughNorth West Cambridgeshire | £2,296.69 | £17.44 | minus £0.40 | Calculated | |
| 7 | Hampton Hargate and ValePrecepting parish | PeterboroughNorth West Cambridgeshire | £2,304.33 | £25.08 | +£0.97 | Calculated | |
| 8 | Orton WatervillePrecepting parish | PeterboroughNorth West Cambridgeshire | £2,306.67 | £27.42 | +£1.31 | Calculated | |
| 9 | EyePrecepting parish | PeterboroughPeterborough | £2,317.29 | £38.04 | +£1.09 | Calculated | |
| 10 | ThorneyPrecepting parish | PeterboroughPeterborough | £2,318.03 | £38.78 | +£0.60 | Calculated | |
| 11 | AilsworthPrecepting parish | PeterboroughNorth West Cambridgeshire | £2,321.58 | £42.33 | +£3.54 | Calculated | |
| 12 | Deeping GatePrecepting parish | PeterboroughNorth West Cambridgeshire | £2,323.80 | £44.55 | +£8.72 | Calculated | |
| 13 | PeakirkPrecepting parish | PeterboroughNorth West Cambridgeshire | £2,328.16 | £48.91 | minus £0.28 | Calculated | |
| 14 | MaxeyPrecepting parish | PeterboroughNorth West Cambridgeshire | £2,328.73 | £49.48 | +£7.16 | Calculated | |
| 15 | GlintonPrecepting parish | PeterboroughNorth West Cambridgeshire | £2,329.25 | £50.00 | +£4.00 | Calculated | |
| 16 | Newborough and Borough FenPrecepting parish | PeterboroughPeterborough | £2,331.14 | £51.89 | minus £11.59 | Calculated | |
| 17 | BarnackPrecepting parish | PeterboroughNorth West Cambridgeshire | £2,334.25 | £55.00 | +£15.00 | Calculated | |
| 18 | NorthboroughPrecepting parish | PeterboroughNorth West Cambridgeshire | £2,334.64 | £55.39 | +£1.93 | Calculated | |
| 19 | EttonPrecepting parish | PeterboroughNorth West Cambridgeshire | £2,335.97 | £56.72 | +£4.34 | Calculated | |
| 20 | BrettonPrecepting parish | PeterboroughPeterborough | £2,338.83 | £59.58 | +£0.27 | Calculated | |
| 21 | HelpstonPrecepting parish | PeterboroughNorth West Cambridgeshire | £2,345.85 | £66.60 | minus £2.19 | Calculated | |
| 22 | SouthorpePrecepting parish | PeterboroughNorth West Cambridgeshire | £2,346.27 | £67.02 | +£18.13 | Calculated | |
| 23 | ThornhaughPrecepting parish | PeterboroughNorth West Cambridgeshire | £2,347.78 | £68.53 | +£3.71 | Calculated | |
| 24 | UffordPrecepting parish | PeterboroughNorth West Cambridgeshire | £2,352.60 | £73.35 | +£5.80 | Calculated | |
| 25 | WitteringPrecepting parish | PeterboroughNorth West Cambridgeshire | £2,356.82 | £77.57 | +£5.20 | Calculated | |
| 26 | WansfordPrecepting parish | PeterboroughNorth West Cambridgeshire | £2,359.70 | £80.45 | +£26.20 | Calculated | |
| 27 | BaintonPrecepting parish | PeterboroughNorth West Cambridgeshire | £2,361.22 | £81.97 | minus £2.39 | Calculated | |
| 28 | CastorPrecepting parish | PeterboroughNorth West Cambridgeshire | £2,366.25 | £87.00 | +£2.00 | Calculated | |
| 29 | SuttonPrecepting parish | PeterboroughNorth West Cambridgeshire | £2,414.39 | £135.14 | +£17.00 | Calculated |
Full Band D, positions and differences calculated from: MHCLG Council tax levels 2026/27, Table 10; MHCLG Town and parish council tax 2026/27. Full reference
County and constituency from: ONS ward and constituency lookups. Full reference
What each status means
- Calculated 29 areas
- Calculated from published MHCLG figures.
Parish change is the parish part's change on the previous year, from the same row of the parish return, our calculation. The full bill change is not comparable: Not comparable: a full bill change needs 2025/26 Table 10 components, which this dataset does not hold. The parish part change is from the same row of the parish return.
How this is calculated
Show the formula, a worked example and the rules
Full Band D is the whole Band D bill in one parish or unparished area for 2026/27: what a Band D home pays before discounts, reductions and premiums. It adds up the published Band D charge of every body that bills that area.
Full Band D = the billing council's Band D excluding local precepts (MHCLG Table 10, line 9) + the parish Band D (MHCLG parish return) + the Band D precepts of the county council or Greater London Authority, police, fire and combined authority (Table 10, line 16).
| Part | Band D |
|---|---|
| Burnley council, Band D excluding local precepts (Table 10, line 9) | £351.44 |
| Padiham parish Band D (parish return) | £44.06 |
| Lancashire (Table 10, line 16) | £1,801.75 |
| Lancashire PCC (Table 10, line 16) | £292.40 |
| Lancashire Fire (Table 10, line 16) | £94.73 |
| Full Band D | £2,584.38 |
Burnley Borough Council's own notice prints the same total for Padiham at Band D.
The parts and their sum, our calculation from published figures. Source: MHCLG, Council tax levels set by local authorities in England 2026 to 2027: Table 10, Data_Billing, lines 9 and 16, retrieved 5 October 2026.
Source: MHCLG, Council Tax statistics for town and parish councils in England: 2026 to 2027, Parish_Level_Data, retrieved 5 October 2026.
Councils with special expenses
This council charges special expenses in parts of its area. The national tables spread them across the whole council, so they cannot give the bill in each parish or unparished area. Per area totals are published by the council only. These areas are shown as "Published by the council only" and are not in the order, never estimated. Where a council's own schedule of totals by area is held and checks out, its own figure is used and labelled "Published by the council", with its source: Boston, Broxtowe and South Norfolk among the special expense councils, and County Durham and the City of London, where the council's figure includes charges the national tables spread differently.
Charter trustees and grouped parishes
The part of the council area with no parish council, which charter trustees cover in full (their tax base equals the unparished tax base). The trustees' Band D is added. Charter trustees cover only part of the unparished area of this council, so it has more than one Band D and the national tables cannot say which applies where. This parish is grouped with others for precepting purposes (MHCLG note f) and has no tax base of its own. It takes the Band D of the one row in the council that carries the group's precept and tax base. This parish is grouped with others for precepting purposes (MHCLG note f) and has no tax base of its own. The return does not identify one row that carries its group, so it is listed under its group and not put in order.
Rounding
Parish Band D amounts are as reported by councils and billed, so they may differ by 1p from the precept divided by the tax base (MHCLG note h). They are used as published.
Positions, tax base and constituencies
Position 1 is the lowest full Band D. Equal figures share a position, written with "=", and the next position skips as many places as share it. Only areas with a figure are placed.
The tax base is the number of Band D equivalent properties, as published; for an unparished area it is the council's tax base less its parishes'. Larger places are those with a tax base of 2,000 or more. A tax base is not a population.
Constituencies come from the ONS parish to ward and ward to constituency lookups. The wards this area touches lie in more than one constituency (ONS ward to constituency lookup). It is listed under each and never apportioned. Constituencies of the council's wards that contain no parish (ONS lookups). Wards that are partly parished are not counted, so the list may be incomplete. A postcode alone cannot establish every charge on a property: check the bill or the council's own schedule.
Sources
Full Band D, positions and differences. Full Band D calculated from published figures: the council's Band D excluding local precepts and the major precepts (Table 10), plus the parish Band D. Positions and differences are our calculation from the figures above: lowest first, equal figures share a position.
MHCLG, Council tax levels set by local authorities in England 2026 to 2027: Table 10, Data_Billing, lines 9 and 16, retrieved 5 October 2026; MHCLG, Council Tax statistics for town and parish councils in England: 2026 to 2027, Parish_Level_Data, retrieved 5 October 2026.
County and constituency.
ONS, Parish to Ward to Local Authority District (December 2025) Lookup in EW, retrieved 15 November 2026; ONS, Ward to Westminster Parliamentary Constituency to LAD to CTYUA (May 2025) Lookup in the UK, retrieved 15 November 2026; ONS, Local Authority District to County (December 2024) Lookup in EN, retrieved 15 November 2026. Open Government Licence v3.0. Source: Office for National Statistics licensed under the Open Government Licence v3.0. Contains OS data © Crown copyright and database right 2025.